
 Data Structure
 Networking
 RDBMS
RDBMS Operating System
 Java
Java MS Excel
 iOS
iOS HTML
HTML CSS
CSS Android
 Python
 C Programming
 C++
C++ C#
C# MongoDB
 MySQL
MySQL Javascript
 PHP
PHP
- Selected Reading
- UPSC IAS Exams Notes
- Developer's Best Practices
- Questions and Answers
- Effective Resume Writing
- HR Interview Questions
- Computer Glossary
- Who is Who
How to plot a very simple bar chart (Python, Matplotlib) using input *.txt file?
To plot a very simple bar chart from an input text file, we can take the following steps −
Make an empty list for bar names and heights.
Read a text file and iterate each line.
Append names and heights into lists.
Plot the bar using lists (Step 1).
To display the figure, use show() method.
Example
from matplotlib import pyplot as plt
plt.rcParams["figure.figsize"] = [7.00, 3.50]
plt.rcParams["figure.autolayout"] = True
bar_names = []
bar_heights = []
for line in open("test_data.txt", "r"):
   bar_name, bar_height = line.split()
   bar_names.append(bar_name)
   bar_heights.append(bar_height)
plt.bar(bar_names, bar_heights)
plt.show()
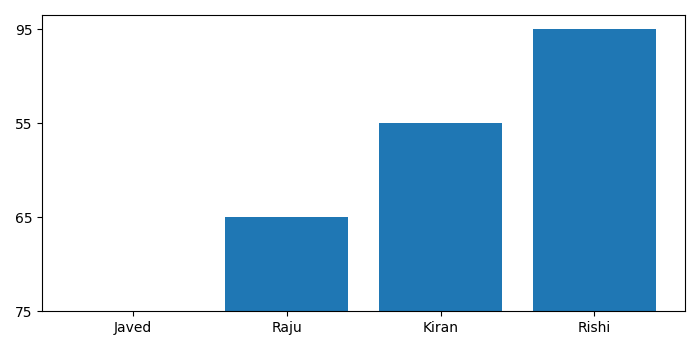
"test_data.txt" contains the following data −
Javed 75
Raju 65
Kiran 55
Rishi 95
Output

Updated on: 2021-05-11T13:25:59+05:30
936 Views

Advertisements