
 Data Structure
 Networking
 RDBMS
RDBMS Operating System
 Java
Java MS Excel
 iOS
iOS HTML
HTML CSS
CSS Android
 Python
 C Programming
 C++
C++ C#
C# MongoDB
 MySQL
MySQL Javascript
 PHP
PHP
- Selected Reading
- UPSC IAS Exams Notes
- Developer's Best Practices
- Questions and Answers
- Effective Resume Writing
- HR Interview Questions
- Computer Glossary
- Who is Who
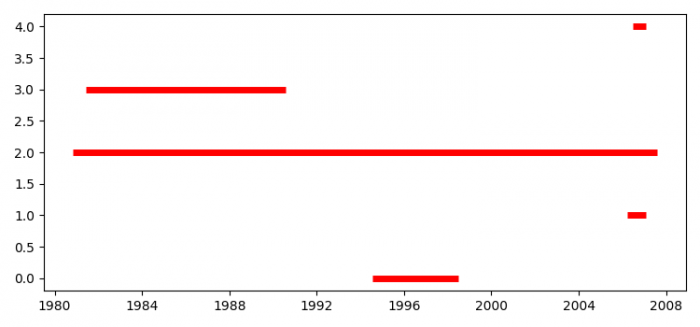
How to plot a stacked event duration using Python Pandas?
To plot a stacked event duration using Python Pandas, we can take the following steps
- Set the figure size and adjust the padding between and around the subplots.
- Create a dataframe with lists of xmin and its corresponding xmax.
- Use hlines() method to plot a stacked event duration.
- To display the figure, use show() method.
Example
import pandas as pd
from datetime import datetime as dt
from matplotlib import pyplot as plt
plt.rcParams["figure.figsize"] = [7.50, 3.50]
plt.rcParams["figure.autolayout"] = True
df = pd.DataFrame(dict(xmin=[dt.strptime('1994-07-19', '%Y-%m-%d'),
   dt.strptime('2006-03-16', '%Y-%m-%d'),
   dt.strptime('1980-10-31', '%Y-%m-%d'),
   dt.strptime('1981-06-11', '%Y-%m-%d'),
   dt.strptime('2006-06-28', '%Y-%m-%d')],
   xmax=[dt.strptime('1998-06-30', '%Y-%m-%d'),
   dt.strptime('2007-01-24', '%Y-%m-%d'),
   dt.strptime('2007-07-31', '%Y-%m-%d'),
   dt.strptime('1990-08-01', '%Y-%m-%d'),
   dt.strptime('2007-01-24', '%Y-%m-%d')]
))
plt.hlines(df.index, df.xmin, df.xmax, lw=5, colors='red')
plt.show()
Output

Updated on: 2021-06-01T12:15:04+05:30
478 Views

Advertisements