
Article Categories
- All Categories
-
 Data Structure
-
 Networking
-
 RDBMS
RDBMS
-
 Operating System
-
 Java
Java
-
 MS Excel
-
 iOS
iOS
-
 HTML
HTML
-
 CSS
CSS
-
 Android
-
 Python
-
 C Programming
-
 C++
C++
-
 C#
C#
-
 MongoDB
-
 MySQL
MySQL
-
 Javascript
-
 PHP
PHP
Selected Reading
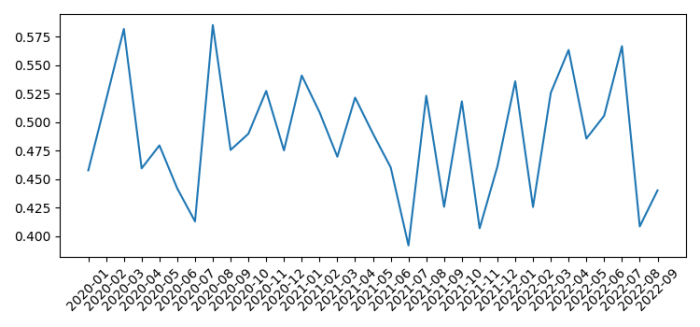
How to plot a Pandas multi-index dataFrame with all xticks (Matplotlib)?
To plot a Pandas multi-index data frame with all xticks, we can take the following steps −
- Set the figure size and adjust the padding between and around the subplots.
- Create index value with 1000 smaples data.
- Make a one-dimensional ndarray with axis labels.
- Get the mean value of the series.
- Plot g dataframe.
- Set the ticks and ticklabel on the current axes
- To display the figure, use show() method.
Example
import numpy as np
import matplotlib.pyplot as plt
import pandas as pd

plt.rcParams["figure.figsize"] = [7.50, 3.50]
plt.rcParams["figure.autolayout"] = True

idx = pd.date_range("2020-01-01", periods=1000)
val = np.random.rand(1000)
s = pd.Series(val, idx)

g = s.groupby([s.index.year, s.index.month]).mean()

ax = g.plot()
ax.set_xticks(range(len(g)))
ax.set_xticklabels(["%s-%02d" % item for item in g.index.tolist()],
rotation=45, ha='center')

plt.show()
Output

Updated on: 2021-06-05T07:38:30+05:30
5K+ Views

Advertisements