
 Data Structure
 Networking
 RDBMS
RDBMS Operating System
 Java
Java MS Excel
 iOS
iOS HTML
HTML CSS
CSS Android
 Python
 C Programming
 C++
C++ C#
C# MongoDB
 MySQL
MySQL Javascript
 PHP
PHP
- Selected Reading
- UPSC IAS Exams Notes
- Developer's Best Practices
- Questions and Answers
- Effective Resume Writing
- HR Interview Questions
- Computer Glossary
- Who is Who
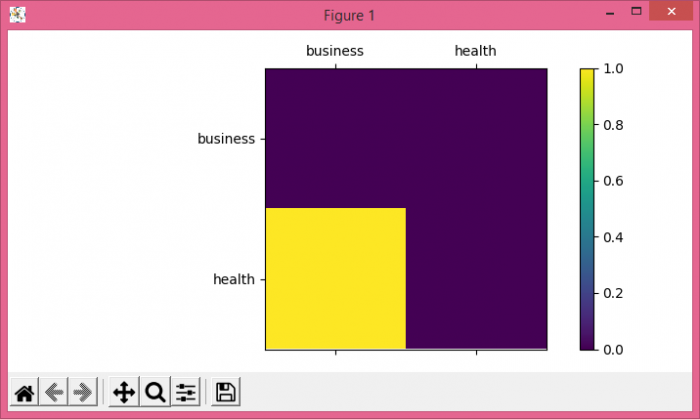
How to plot a confusion matrix with string axis rather than integer in Python?
To plot a confusion matrix with string axis rather than integer in Python, we can take the following steps−
- Make a list for labels.
- Create a confusion matrix. Use confusion_matrix() to calculate accuracy of classification.
- 3. Add an '~.axes.Axes' to the figure as part of a subplot arrangement.
- Plot the values of a 2D matrix or array as a color-coded image.
- Using colorbar() method, create a colorbar for a ScalarMappable instance, *mappable*
- 6. Set x and y ticklabels using set_xticklabels and set_yticklabels methods.
- To display the figure, use show() method.
Example
from matplotlib import pyplot as plt
from sklearn.metrics import confusion_matrix
plt.rcParams["figure.figsize"] = [7.00, 3.50]
plt.rcParams["figure.autolayout"] = True
labels = ['business', 'health']
cm = confusion_matrix([3], [2])
fig = plt.figure()
ax = fig.add_subplot(111)
cax = ax.matshow(cm)
fig.colorbar(cax)
ax.set_xticklabels([''] + labels)
ax.set_yticklabels([''] + labels)
plt.show()
Output

Updated on: 2021-05-06T12:54:44+05:30
666 Views

Advertisements