
 Data Structure
 Networking
 RDBMS
RDBMS Operating System
 Java
Java MS Excel
 iOS
iOS HTML
HTML CSS
CSS Android
 Python
 C Programming
 C++
C++ C#
C# MongoDB
 MySQL
MySQL Javascript
 PHP
PHP
- Selected Reading
- UPSC IAS Exams Notes
- Developer's Best Practices
- Questions and Answers
- Effective Resume Writing
- HR Interview Questions
- Computer Glossary
- Who is Who
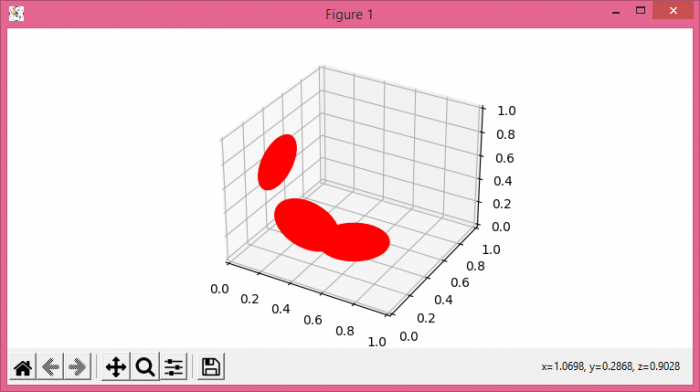
How to plot a 3D patch collection in matplotlib?
To plot a 3D patch collection in matplotlib, we can take the following steps −
- Set the figure size and adjust the padding between and around the subplots.
- Create a new figure or activate an existing figure.
- Get the current axes and set projection as 3d.
- Iterate ["x", "y", "z"] list, and set the circle patch using pathpatch_2d_to_3d() method to convert a PathPatch to a PathPatch3D object.
- To display the figure, use show() method.
Example
import matplotlib.pyplot as plt
from matplotlib.patches import Circle
import mpl_toolkits.mplot3d.art3d as art3d

plt.rcParams["figure.figsize"] = [7.50, 3.50]
plt.rcParams["figure.autolayout"] = True

fig = plt.figure()
ax = fig.gca(projection='3d')

for i in ["x", "y", "z"]:
   cir = Circle((0.5, 0.5), 0.2, color='red')
   ax.add_patch(cir)
   art3d.pathpatch_2d_to_3d(cir, z=0, zdir=i)

plt.show()
Output


Updated on: 2021-08-03T13:13:48+05:30
1K+ Views

Advertisements