
 Data Structure
 Networking
 RDBMS
RDBMS Operating System
 Java
Java MS Excel
 iOS
iOS HTML
HTML CSS
CSS Android
 Python
 C Programming
 C++
C++ C#
C# MongoDB
 MySQL
MySQL Javascript
 PHP
PHP
- Selected Reading
- UPSC IAS Exams Notes
- Developer's Best Practices
- Questions and Answers
- Effective Resume Writing
- HR Interview Questions
- Computer Glossary
- Who is Who
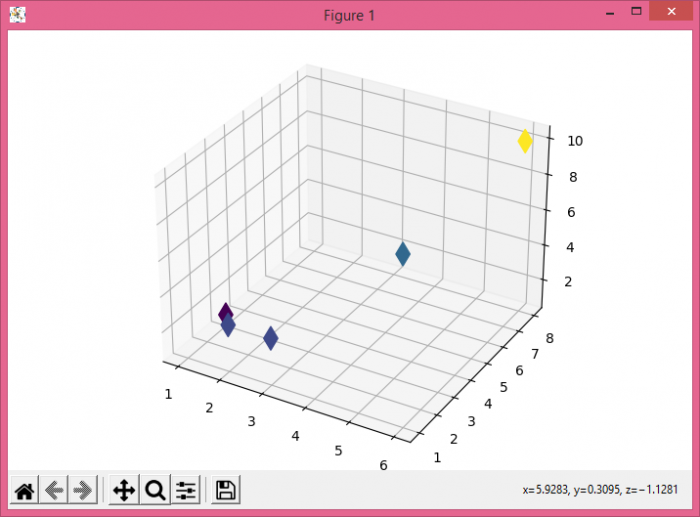
How to plot 3D graphs using Python Matplotlib?
To plot 3D graphs using Python, we can take the following steps −
Create a new figure or activate an existing figure using figure() method.
Get the 3D axes object.
Make x, y, and z lists for data points.
Add 3D scatter points using scatter3D() method, with x, y, and z data points with markersize=150 and marker=diamond.
To display the figure, use show() method.
Example
from mpl_toolkits.mplot3d import Axes3D
from matplotlib import pyplot as plt
plt.rcParams["figure.figsize"] = [7.00, 3.50]
plt.rcParams["figure.autolayout"] = True
fig = plt.figure()
ax = Axes3D(fig)
x = [2, 4, 6, 3, 1]
y = [1, 6, 8, 1, 3]
z = [3, 4, 10, 3, 1]
ax.scatter3D(x, y, z, c=z, alpha=1, marker='d', s=150)
plt.show()
Output

Updated on: 2021-05-12T12:17:08+05:30
2K+ Views

Advertisements