
 Data Structure
 Networking
 RDBMS
RDBMS Operating System
 Java
Java MS Excel
 iOS
iOS HTML
HTML CSS
CSS Android
 Python
 C Programming
 C++
C++ C#
C# MongoDB
 MySQL
MySQL Javascript
 PHP
PHP
- Selected Reading
- UPSC IAS Exams Notes
- Developer's Best Practices
- Questions and Answers
- Effective Resume Writing
- HR Interview Questions
- Computer Glossary
- Who is Who
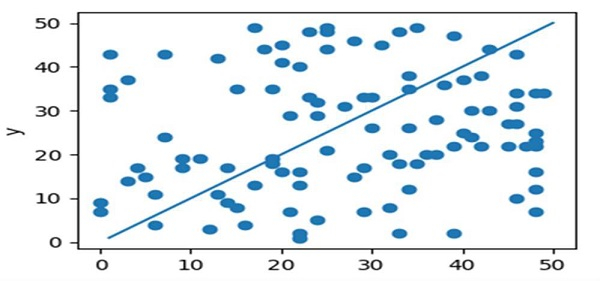
How to overplot a line on a scatter plot in Python?
First, we can create a scatter for different data points using the scatter method, and then, we can plot the lines using the plot method.
Steps
Create a new figure, or activate an existing figure with figure size(4, 3), using figure() method.
Add an axis to the current figure and make it the current axes, create x using plt.axes().
Draw scatter points using scatter() method.
Draw line using ax.plot() method.
Set the X-axis label using plt.xlabel() method.
Set the Y-axis label using plt.ylabel() method.
To show the plot, use plt.show() method.
Example
import random
import matplotlib.pyplot as plt

plt.figure(figsize=(4, 3))
ax = plt.axes()
ax.scatter([random.randint(1, 1000) % 50 for i in range(100)],
[random.randint(1, 1000) % 50 for i in range(100)])
ax.plot([1, 2, 4, 50], [1, 2, 4, 50])

ax.set_xlabel('x')
ax.set_ylabel('y')

plt.show()
Output

Updated on: 2021-03-17T08:48:17+05:30
14K+ Views

Advertisements