
Article Categories
- All Categories
-
 Data Structure
-
 Networking
-
 RDBMS
RDBMS
-
 Operating System
-
 Java
Java
-
 MS Excel
-
 iOS
iOS
-
 HTML
HTML
-
 CSS
CSS
-
 Android
-
 Python
-
 C Programming
-
 C++
C++
-
 C#
C#
-
 MongoDB
-
 MySQL
MySQL
-
 Javascript
-
 PHP
PHP
Selected Reading
How to modify a Matplotlib legend after it has been created?
To modify a Matplotlib legend after it has been created, we can have multiple methods to modify the created legend.
- Set the figure size and adjust the padding between and around the subplots.
- Plot a line using plot() method, with two lists and a label.
- Use legend() method to place a legend over the plot.
- To modify the matplotlib legend, use set_title() method.
- To display the figure, use show() method.
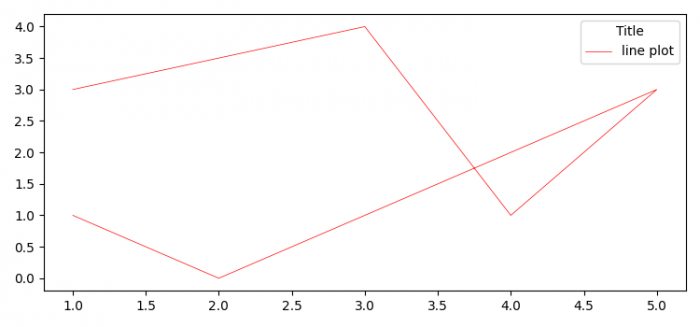
Example
from matplotlib import pyplot as plt

plt.rcParams["figure.figsize"] = [7.50, 3.50]
plt.rcParams["figure.autolayout"] = True

plt.plot([1, 3, 4, 5, 2, 1], [3, 4, 1, 3, 0, 1],
         label="line plot", color='red', lw=0.5)

leg = plt.legend(loc="upper right")
leg.set_title("Title")

plt.show()
Output

Updated on: 2021-06-18T10:34:44+05:30
2K+ Views

Advertisements