
 Data Structure
 Networking
 RDBMS
RDBMS Operating System
 Java
Java MS Excel
 iOS
iOS HTML
HTML CSS
CSS Android
 Python
 C Programming
 C++
C++ C#
C# MongoDB
 MySQL
MySQL Javascript
 PHP
PHP
- Selected Reading
- UPSC IAS Exams Notes
- Developer's Best Practices
- Questions and Answers
- Effective Resume Writing
- HR Interview Questions
- Computer Glossary
- Who is Who
How to merge two existing Matplotlib plots into one plot?
To merge two existing matplotlib plots into one plot, we can take the following steps −
- Set the figure size and adjust the padding between and around the subplots.
- Create x, y1 and y2 data points using numpy.
- Plot (x, y1) and (x, y2) points using plot() method.
- Get the xy data points of the current axes.
- Use argsort() to return the indices that would sort an array.
- Append x and y data points of each plot.
- Plot X and Y data points at the 2nd index subplot.
- To display the figure, use show() method.
Example
import numpy as np
import matplotlib.pyplot as plt

plt.rcParams["figure.figsize"] = [7.50, 3.50]
plt.rcParams["figure.autolayout"] = True

x = np.linspace(-10, 10, 100)
y1 = np.sin(x)
y2 = np.cos(x)

plt.subplot(211)
plt.plot(x, y1, color='red', lw=5)
plt.plot(x, y2, color='orange', lw=7)

X, Y = [], []

for lines in plt.gca().get_lines():
   for x, y in lines.get_xydata():
      X.append(x)
      Y.append(y)

idx = np.argsort(X)
X = np.array(X)[idx]
Y = np.array(Y)[idx]

plt.subplot(212)

plt.plot(X, Y, color='green', lw=0.75)

plt.show()
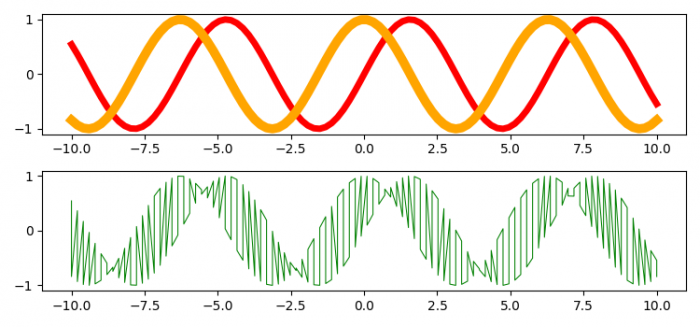
Output


Updated on: 2021-08-04T12:19:13+05:30
17K+ Views

Advertisements