 Data Structure
 Networking
 RDBMS
RDBMS Operating System
 Java
Java MS Excel
 iOS
iOS HTML
HTML CSS
CSS Android
 Python
 C Programming
 C++
C++ C#
C# MongoDB
 MySQL
MySQL Javascript
 PHP
PHPPhysics
Chemistry
Biology
Mathematics
English
Economics
Psychology
Social Studies
Fashion Studies
Legal Studies
- Selected Reading
- UPSC IAS Exams Notes
- Developer's Best Practices
- Questions and Answers
- Effective Resume Writing
- HR Interview Questions
- Computer Glossary
- Who is Who
How to make Violinpot with data points in Seaborn?
In data analysis and visualization, there are many types of plots that are used to convey information in a concise and meaningful manner. One of the popular types of plots is the Violin plot, which is useful for visualizing the distribution of a numeric variable for different categories or groups. The Violin plot is similar to a box plot, but it provides more information about the distribution of the data by displaying a density plot on top of the box plot. In this tutorial, we will learn how to create a Violin plot with data points in Seaborn using our own created dataset.
To create a Violin plot in Seaborn, we must import the necessary libraries, such as Seaborn, Matplotlib, and Pandas. Seaborn is used to create the plot, Matplotlib is used to customize the plot, and Pandas is used to store and manipulate the data.
Syntax
To create a Violin plot, you need to follow this syntax −
# Create violin plot
sns.violinplot(data=data, x="x_variable", y="y_variable", hue="categorical_variable", split=True)

# Show the plot
plt.show()
We call the violinplot() function to create our violin plot. We pass in our data, specifying the x and y variables to be plotted and the hue variable for coloring the violins by a categorical variable. The split parameter is set to True to split the violins by category. Finally, we call the show() function to display the plot.
Example
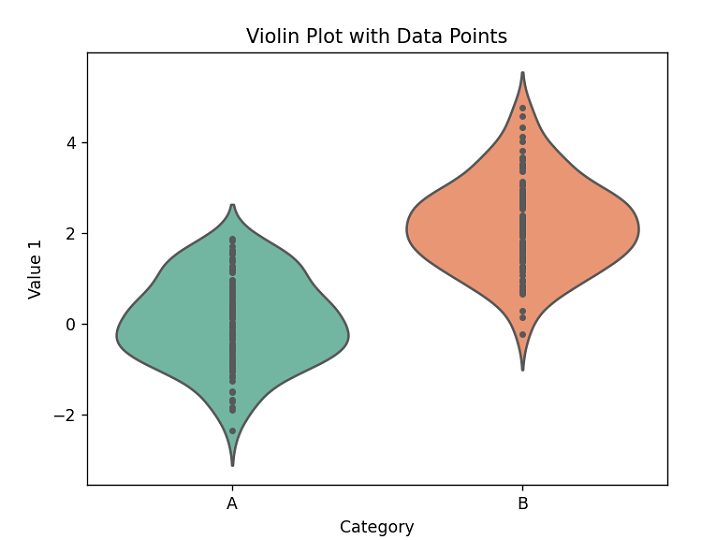
In this example, we will create a dataset that consists of the following variables: Category, Value 1, and Value 2. We will create two categories, Category A and Category B, with 100 values each. The values will be randomly generated using the Numpy library.
Now that we have created the dataset, we can use Seaborn to create the Violin plot. We will use the violinplot() function to create the plot. The violinplot() function takes the following arguments −
x − The column name or index of the variable to be plotted.
y − The column name or index of the variable to be used for grouping the data.
data − The DataFrame containing the data to be plotted.
inner − The type of plot to be displayed inside the Violin plot. The default value is 'box', but we can change it to 'points' to display data points inside the Violin plot.
palette − The color palette to be used for the different categories or groups.
The following code will create the Violin plot with data points −
import numpy as np
import pandas as pd
import seaborn as sns
import matplotlib.pyplot as plt

# Create a dataset with two categories and 100 values in each category
category_a = np.random.normal(0, 1, 100)
category_b = np.random.normal(2, 1, 100)
data = pd.DataFrame({'Category': ['A'] * 100 + ['B'] * 100, 'Value 1': np.concatenate((category_a, category_b)), 'Value 2': np.concatenate((category_b, category_a))})

# Create a Violin plot with data points
sns.violinplot(x='Category', y='Value 1', data=data, inner='points', palette='Set2')

# Customize the plot
plt.title('Violin Plot with Data Points')
plt.xlabel('Category')
plt.ylabel('Value 1')

# Display the plot
plt.show()
Output

Example
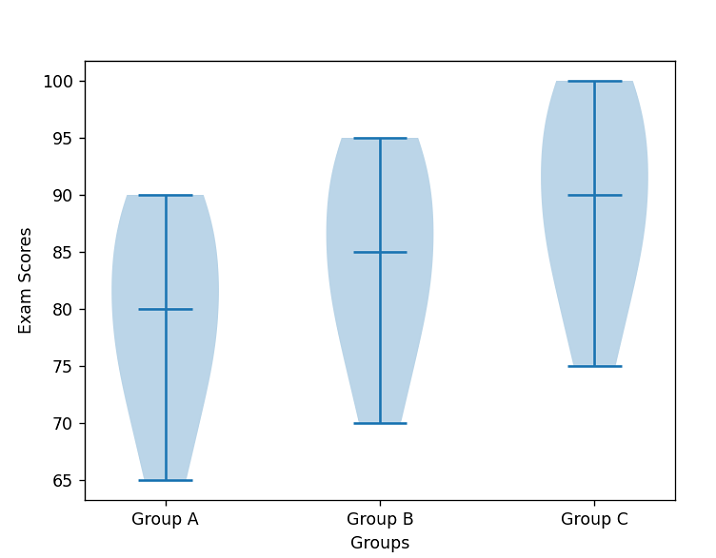
A dataset of exam scores is created, which consists of three groups (Group A, Group B, and Group C) with 10 scores each. The exam scores are hardcoded in the code, unlike the random data in the previous example. Next, the dataset is converted to a Pandas dataframe using the pd.DataFrame function.
After that, a figure and axis object is created using the subplots function. A violin plot is then created using the violinplot function of the axis object. The showmedians parameter is set to True to show the median of each group on the plot.
The x-ticks and labels are set to display the group names using the set_xticks and set_xticklabels functions, and the x and y axis labels are set using the set_xlabel and set_ylabel functions.
import numpy as np
import pandas as pd
import matplotlib.pyplot as plt

# create a dataset of exam scores for three groups of students
data = {'Group A': [75, 80, 85, 90, 70, 65, 90, 85, 80, 75],     'Group B': [80, 85, 90, 95, 75, 70, 95, 90, 85, 80],     'Group C': [85, 90, 95, 100, 80, 75, 100, 95, 90, 85], }

# convert the data to a pandas dataframe
df = pd.DataFrame(data)

# plot the violin plot using matplotlib
fig, ax = plt.subplots()
ax.violinplot(df.values, showmedians=True)
ax.set_xticks(np.arange(1, len(df.columns)+1))
ax.set_xticklabels(df.columns)
ax.set_xlabel('Groups')
ax.set_ylabel('Exam Scores')
plt.show()
Output

Conclusion
We discussed how violin plots are similar to box plots but show a more detailed view of the distribution of the data. We learned that Seaborn is a higher-level library that provides more advanced and aesthetically pleasing statistical graphics, while Matplotlib is a lower-level library that provides more control over the plot's details. Finally, we saw that violin plots are an effective way to compare the distribution of data between different groups or categories, making them a valuable tool for exploratory data analysis.

