
 Data Structure
 Networking
 RDBMS
RDBMS Operating System
 Java
Java MS Excel
 iOS
iOS HTML
HTML CSS
CSS Android
 Python
 C Programming
 C++
C++ C#
C# MongoDB
 MySQL
MySQL Javascript
 PHP
PHP
- Selected Reading
- UPSC IAS Exams Notes
- Developer's Best Practices
- Questions and Answers
- Effective Resume Writing
- HR Interview Questions
- Computer Glossary
- Who is Who
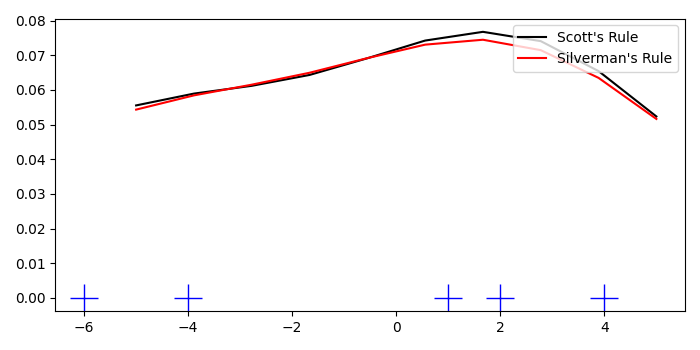
How to make a rug plot in Matplotlib?
Rug plots are used to visualize the distribution of data. It is a plot of data for a single variable, displayed as marks along an axis. To make a rug plot in Matplotlib, we can take the following steps −
- Set the figure size and adjust the padding between and around the subplots.
- Create x data points using numpy.
- Add representation of a kernel-density estimate using Gaussian kernels, kde1 and kde2.
- Create a new figure or activate an existing figure using figure() method.
- Add an 'ax1' to the figure as part of a subplot arrangement.
- Make a rug plot with marker_size=20.
- Plot x_eval, kde1(x_eval) and kde2(x_eval) data points using plot() method.
- Place a legend on the plot.
- To display the figure, use show() method.
Example
import numpy as np
from scipy import stats
import matplotlib.pyplot as plt

plt.rcParams["figure.figsize"] = [7.00, 3.50]
plt.rcParams["figure.autolayout"] = True

x = np.array([-6, -4, 2, 1, 4], dtype=np.float)

kde1 = stats.gaussian_kde(x)
kde2 = stats.gaussian_kde(x, bw_method='silverman')

fig = plt.figure()

ax = fig.add_subplot(111)
ax.plot(x, np.zeros(x.shape), 'b+', ms=20)

x_eval = np.linspace(-5, 5, num=10)
ax.plot(x_eval, kde1(x_eval), 'k-', label="Scott's Rule")
ax.plot(x_eval, kde2(x_eval), 'r-', label="Silverman's Rule")

plt.legend(loc='upper right')

plt.show()
Output
It will produce the following output


Updated on: 2021-09-20T10:37:03+05:30
877 Views

Advertisements