
Article Categories
- All Categories
-
 Data Structure
-
 Networking
-
 RDBMS
RDBMS
-
 Operating System
-
 Java
Java
-
 MS Excel
-
 iOS
iOS
-
 HTML
HTML
-
 CSS
CSS
-
 Android
-
 Python
-
 C Programming
-
 C++
C++
-
 C#
C#
-
 MongoDB
-
 MySQL
MySQL
-
 Javascript
-
 PHP
PHP
-
 Economics & Finance
How to install and configure prometheus using docker on centos 7
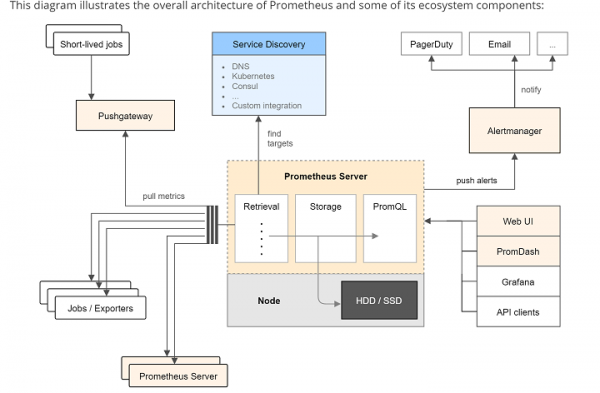
In this article, we will learn how to install Prometheus server to collect the metrics and query them and also install Grafana – a web based graphical dashboard builder. Prometheus is an open source monitoring tool with time series database. It addresses many aspects for monitoring and generating a collection of metrics and graphs for resulting the data on the dashboards along with alerting.
Prerequisites
To complete this article we needed these resources CentOS 7 installed, a user with sudo access and Dockers installed.
Installing the Prometheus
We are installing the Prometheus using the Dockers, so make sure that we already installed Docker on the CentOS 7 machine. Dockers container images for Prometheus components are located under the prom organization from the Dockers Hub. We can start the Docker image without using any options using the demo configuration which is located at /etc/Prometheus/Prometheus.yml.
We have multiple ways of overriding the default config files. A custom configuration file may be used into the container from the host system as a Docker data volume or we can choose a build Docker container with our own configuration, her for demo purpose we will choose to pass in the config file from the host system.
Creating a Minimum Prometheus Configuration
$ nano ~/prometheus.yml
# A scrape configuration scraping a Node Exporter and the Prometheus server
# itself.
scrape_configs:
# Scrape Prometheus itself every 5 seconds.
- job_name: 'prometheus'
scrape_interval: 5s
target_groups:
- targets: ['localhost:9090']
# Scrape the Node Exporter every 5 seconds.
- job_name: 'node'
scrape_interval: 5s
target_groups:
- targets: ['192.168.1.100:9100']
Start the Prometheus Docker container with this external configuration file using the below command
$ docker run -d -p 9090:9090 -v ~/prometheus.yml:/etc/prometheus/prometheus.yml prom/prometheus -config.file=/etc/prometheus/prometheus.yml -storage.local.path=/prometheus -storage.local.memory-chunks=10000
This command is quite long and contains many commands in one line with many options.
We will see each and every option used in the above command
The -d option starts the Prometheus container to start in detached mode, meaning that the container will be started in the background and will not be terminated by pressing CTRL+C.
The -p 9090:9090 option allows the Prometheus's web port (9090) and makes it reachable via the external IP address of the host system.
The -v [...] option mounts the prometheus.yml configuration file from the host filesystem from the location within the container where Prometheus expects it (/etc/prometheus/prometheus.yml)
The -config.file option is instruct the Dockers accordingly to the location of the Prometheus configuration file within the container.
The -storage.local.path option configures the metrics storage location within the container.
Finally, the -storage.local.memory-chunks option adjusts Prometheus's memory usage to the host system's very small amount of RAM (only 512MB) and small number of stored time series in this tutorial (just under 1000)
It instructs Prometheus to keep only 10000 sample chunks in memory (roughly 10 chunks per series), instead of the default of 1048576. This is a value you will definitely need to tune when running Prometheus on a machine with more RAM and when storing more time serie
Refer to Prometheus's storage documentation for detailed usage.
As this is the first time we have run the command this will download the contents from Dockers hub.
We can use the docker ps command to see the Docker containers available in local machine.
$ docker ps
CONTAINER ID IMAGE COMMAND CREATED STATUS PORTS NAMES
55e31548c9a0 prom/prometheus "/bin/prometheus -con" 26 seconds ago Up 24 seconds 0.0.0.0:9090->9090/tcp cocky_fermat
We can use the container ID which we get from the docker ps command to see the logs for the Prometheus server, below is the command to see the logs
$ docker logs 55e31548c9a0
time="2016-07-11T19:56:44Z" level=info msg="Starting prometheus (version=0.20.0, branch=master, revision=aeab25c)" source="main.go:73"
time="2016-07-11T19:56:44Z" level=info msg="Build context (go=go1.6.2, user=root@77050118f904, date=20160616-08:38:14)" source="main.go:74"
time="2016-07-11T19:56:44Z" level=info msg="Loading configuration file /etc/prometheus/prometheus.yml" source="main.go:206"
time="2016-07-11T19:56:44Z" level=warning msg="The 'target_groups' option for scrape configurations is deprecated, use 'static_configs' instead" source="config.go:468"
time="2016-07-11T19:56:44Z" level=warning msg="The 'target_groups' option for scrape configurations is deprecated, use 'static_configs' instead" source="config.go:468"
time="2016-07-11T19:56:44Z" level=info msg="Loading series map and head chunks..." source="storage.go:341"
time="2016-07-11T19:56:44Z" level=info msg="0 series loaded." source="storage.go:346"
time="2016-07-11T19:56:44Z" level=info msg="Starting target manager..." source="targetmanager.go:74"
time="2016-07-11T19:56:44Z" level=warning msg="No AlertManagers configured, not dispatching any alerts" source="notifier.go:174"
time="2016-07-11T19:56:44Z" level=info msg="Listening on :9090" source="web.go:241"
To find out the storage volumes stored, we can run the below command
$ docker inspect 55e31548c9a0
[
   {
      "Id": "55e31548c9a0273bd91340bf08f5eb55996c8fe9a648b819b348d1a5af08990b",
      "Created": "2016-07-11T19:56:43.814310728Z",
      "Path": "/bin/prometheus",
      "Args": [
         "-config.file=/etc/prometheus/prometheus.yml",
         "-storage.local.path=/prometheus",
         "-storage.local.memory-chunks=10000"
      ],
      "State": {
         "Status": "running",
         "Running": true,
         "Paused": false,
         "Restarting": false,
         "OOMKilled": false,
         "Dead": false,
         "Pid": 4803,
         "ExitCode": 0,
         …
         …
         "Gateway": "172.17.0.1",
         "GlobalIPv6Address": "",
         "GlobalIPv6PrefixLen": 0,
         "IPAddress": "172.17.0.2",
         "IPPrefixLen": 16,
         "IPv6Gateway": "",
         "MacAddress": "02:42:ac:11:00:02",
         "Networks": {
            "bridge": {
               "IPAMConfig": null,
               "Links": null,
               "Aliases": null,
               "NetworkID": "4bbd72d2b2defe67b5223fe7f89919b9dd952e13f1d273ac871e8af1486b92c4",
               "EndpointID": "b35f6fe49c02b8a6593e4e8549f1ab46a6bdc3b94f0279315f49a30725832e74",
               "Gateway": "172.17.0.1",
               "IPAddress": "172.17.0.2",
               "IPPrefixLen": 16,
               "IPv6Gateway": "",
               "GlobalIPv6Address": "",
               "GlobalIPv6PrefixLen": 0,
               "MacAddress": "02:42:ac:11:00:02"
            }
         }
      }
   }
]
...
...
We can find that in the section
"Mounts": [
   {
      "Source": "/root/prometheus.yml",
      "Destination": "/etc/prometheus/prometheus.yml",
      "Mode": "",
      "RW": true,
      "Propagation": "rprivate"
   },
   {
      "Name": "1dd33b889f2fe804ceceb90d4100767a14a21b09ba880972f25a2bf452d31150",
      "Source":       "/var/lib/docker/volumes/1dd33b889f2fe804ceceb90d4100767a14a21b09ba880972f25a2bf452d31150/_data",
      "Destination": "/prometheus",
      "Driver": "local",
      "Mode": "",
      "RW": true,
      "Propagation": ""
   }
   ...
...
From the output, we can observe that the metrics are stored in the following – “
/var/lib/docker/volumes/1dd33b889f2fe804ceceb90d4100767 a14a21b09ba880972f25a2bf452d31150/_data”
Logging into Prometheus Dashboard
The directory was automatically created and mapped to /Prometheus directory in the container.
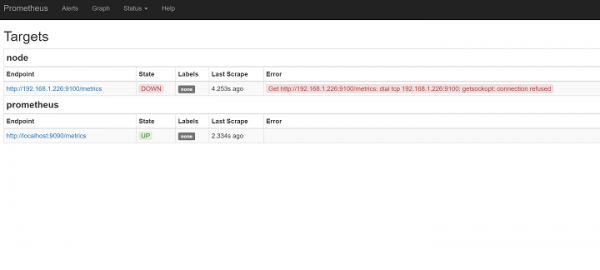
As we can see that, the container is up and running and we can now check the Prometheus server at http://your_ip:9090/ or http://192.168.1.226:9090/status (Note: The IP Address may differ from this demo to your setup so use your host IP address).

We have to click on the status and click on the targets. We can See UNHEALTHY as the node and see that the node exporter has not yet started.
Setting up the Node Exporter
Here we will install the Prometheus Node Exporter. The Node Exporter is the server that exposes the Prometheus metrics of the host machine and it is running in which, it show the machine’s file system, networking devices, processor, memory usages and others too.
As our requirement is to manage all the process using the Docker, we will have the workaround to provide an approximation of metrics from Docker.
To start the Node Exporter on the port 9100, use the below command using the Docker.
$ docker run -d -p 9100:9100 -v "/proc:/host/proc" -v "/sys:/host/sys" -v "/:/rootfs" --net="host" prom/node-exporter -collector.procfs /host/proc -collector.sysfs /host/proc -collector.filesystem.ignored-mount-points "^/(sys|proc|dev|host|etc)($|/)"
Unable to find image 'prom/node-exporter:latest' locally
latest: Pulling from prom/node-exporter
385e281300cc: Already exists
a3ed95caeb02: Pull complete
e418e02f5f37: Already exists
061d745f0f4c: Pull complete
Digest: sha256:a2ae701df7f3ace9f60b890415db9310dd8c28b5446002c4e8ebd102242d076e
Status: Downloaded newer image for prom/node-exporter:latest
49c08ad640f10556fedc517532386d11fbf9a9b49fcf4c14c463ef5dab4a0737
The Options used for Node Exporter are
As most of the metircs are gathered from /proc and /sys from the Linux file system, and the /host dircotory using the Docker’s –v option
-collector.procfs and –collector.sysfs. They are used to instruct the Node Exporter to look for the /proc and /sys folders for a non-standard location
Dockers –v flag is used to mount the entire root (/) file system into the contain as (/rootfs)
-collector.filesystem.ignored-mount-points is used to ignore any other filesystem container which are belong to the host system.
--net=host is used to place the container in the same network as the host so that it can read the /proc/net/dev
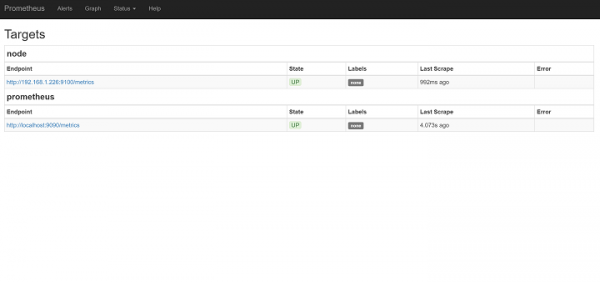
As we can see, the Prometheus server will automatically start the scraping of the Node Exporter.
http://192.168.1.226:9090/status
http://192.168.1.226:9100/metrics
Setting up the Grafana
As the Prometheus server is installed and ready, we will now set-up Grafana. Grafana is a graphic interface with a dashboard which supports Promethus as a back-end to query for the data to generate the graph.
Grafana stores the data in SQL based database, Grafana supports SQLite3, MySQL or PostgreSQL for this. In this tutorial we are using the SQLite3 Database for storing the database.
Launching Grafana as a Docker container with an administrator password
$ docker run -d -p 3000:3000 -e "GF_SECURITY_ADMIN_PASSWORD=password" -v ~/grafana_db:/var/lib/grafana grafana/grafana
Unable to find image 'grafana/grafana:latest' locally
latest: Pulling from grafana/grafana
5c90d4a2d1a8: Pull complete
b1a9a0b6158e: Pull complete
acb23b0d58de: Pull complete
Digest: sha256:34ca2f9c7986cb2d115eea373083f7150a2b9b753210546d14477e2276074ae1
Status: Downloaded newer image for grafana/grafana:latest
5a2041049010fa0be8b23906cb2d864de7ff9a71e4930f686bc07eff24667d5a
The above command will download the Grafana Docker image from Docker Hub and stores at ~/grafana_db on the local system this will automatically create and initialize the SQLite3 database at /var/lib/grafana/grafana.db
The –e option will pass the environment variables to process the Docker container and GF-SERCURITY_ADMIN_PASSWORD variable to the desired dashboard administrator password for admin user. The Grafana is currently running on port 3000
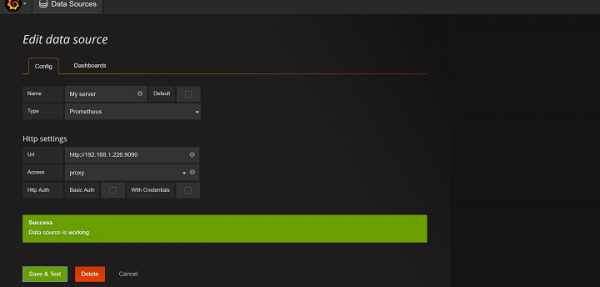
To login into the Grafana, open the link https://192.168.1.226:3000. The IP address may differ from one system to another.

As there is no system added for monitoring, we will add https://192.168.1.226:9090 from Grafana icon Datasource and add the Prometheus server
As we have configured the Prometheus server, a Node Exporter and Grafana all using the Docker, as they are all running the same machine and this is for the demo purpose only. We can learn more about Prometheus and Grafana from the respective documentation.

1K+ Views
