
Article Categories
- All Categories
-
 Data Structure
-
 Networking
-
 RDBMS
RDBMS
-
 Operating System
-
 Java
Java
-
 MS Excel
-
 iOS
iOS
-
 HTML
HTML
-
 CSS
CSS
-
 Android
-
 Python
-
 C Programming
-
 C++
C++
-
 C#
C#
-
 MongoDB
-
 MySQL
MySQL
-
 Javascript
-
 PHP
PHP
Selected Reading
How to hide outliers in base R boxplot?
To hide outliers in base R boxplot, we can use range argument inside boxplot function but we will have to play with range argument. The range argument can take many values therefore, we would need to find the correct one that removes all the outliers. To understand how it works check out the Example given below −
Example
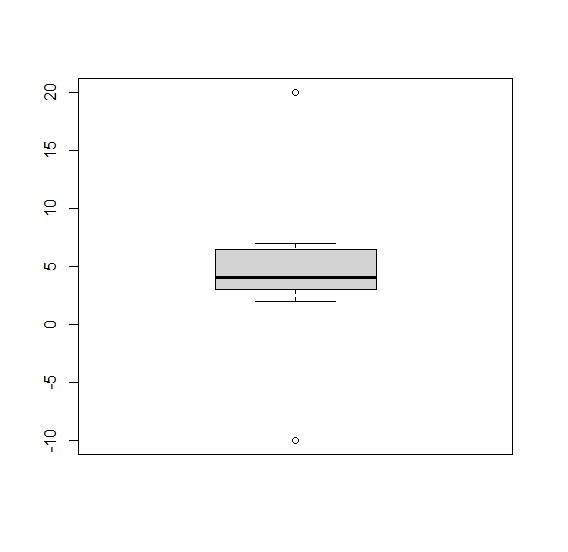
To hide outliners in base R boxplot, use the following snippet −
x<-c(-10,rpois(10,5),20)
boxplot(x)
Output
If you execute the above given snippet, it generates the following Output −
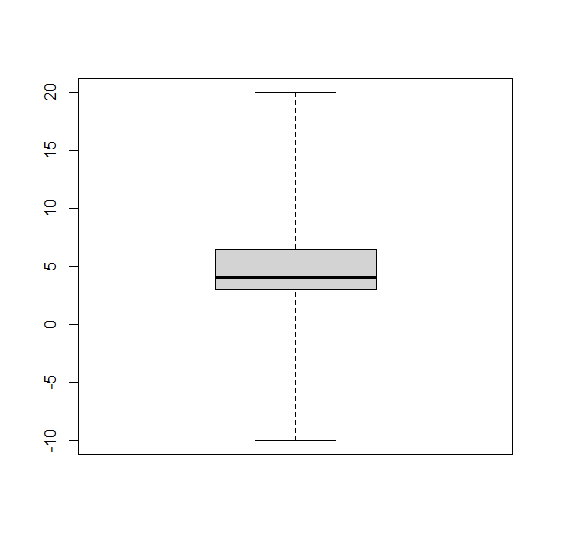
To hide outliners in base R boxplot, add the following code to the above snippet −
x<-c(-10,rpois(10,5),20)
boxplot(x,range=4)
Output
If you execute all the above given snippets as a single program, it generates the following Output −

Updated on: 2021-11-05T06:54:45+05:30
394 Views

Advertisements