
Article Categories
- All Categories
-
 Data Structure
-
 Networking
-
 RDBMS
RDBMS
-
 Operating System
-
 Java
Java
-
 MS Excel
-
 iOS
iOS
-
 HTML
HTML
-
 CSS
CSS
-
 Android
-
 Python
-
 C Programming
-
 C++
C++
-
 C#
C#
-
 MongoDB
-
 MySQL
MySQL
-
 Javascript
-
 PHP
PHP
-
 Economics & Finance
Selected Reading
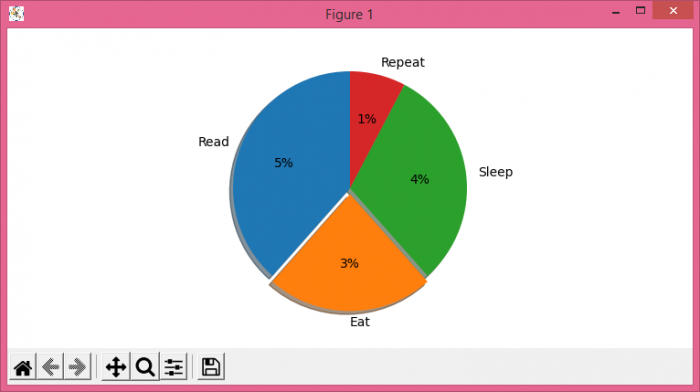
How to have actual values in Matplotlib Pie Chart displayed?
To have actual or any custom values in Matplotlib pie chart displayed, we can take the following steps −
- Set the figure size and adjust the padding between and around the subplots.
- Make lists of labels, fractions, explode position and get the sum of fractions to calculate the percentage
- Make a pie chart using labels, fracs and explode with autopct=lambda p:
. - To display the figure, use show() method.
Example
import matplotlib.pyplot as plt

plt.rcParams["figure.figsize"] = [7.50, 3.50]
plt.rcParams["figure.autolayout"] = True

labels = ('Read', 'Eat', 'Sleep', 'Repeat')

fracs = [5, 3, 4, 1]
total = sum(fracs)
explode = (0, 0.05, 0, 0)

plt.pie(fracs, explode=explode, labels=labels,
   autopct=lambda p: '{:.0f}%'.format(p * total / 100),
   shadow=True, startangle=90)

plt.show()
Output

Updated on: 2021-06-17T12:05:32+05:30
7K+ Views

Advertisements