
Article Categories
- All Categories
-
 Data Structure
-
 Networking
-
 RDBMS
RDBMS
-
 Operating System
-
 Java
Java
-
 MS Excel
-
 iOS
iOS
-
 HTML
HTML
-
 CSS
CSS
-
 Android
-
 Python
-
 C Programming
-
 C++
C++
-
 C#
C#
-
 MongoDB
-
 MySQL
MySQL
-
 Javascript
-
 PHP
PHP
-
 Economics & Finance
Selected Reading
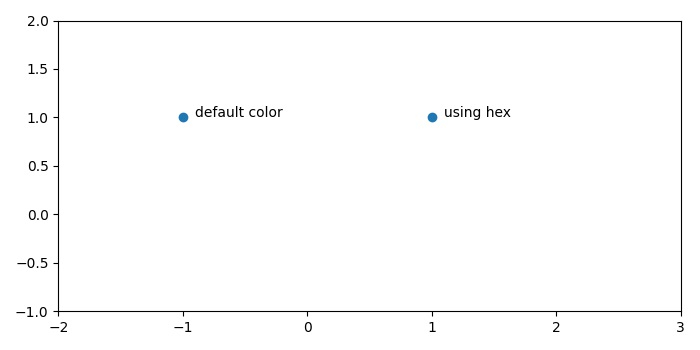
How to get the default blue colour of matplotlib.pyplot.scatter?
The default color of a scatter point is blue. To get the default blue color of matplotlib scatter point, we can annotate them using annotate() method.
Steps
- Create a figure and a set of subplots using subplots() method.
- Plot a scatter point at (-1, 1) location.
- Add some label for that point.
- Plot a scatter point at (-0.9, 1) location.
- Add some label for that point.
- Plot a scatter point at (1.9, 1) location.
- Add some label for that point.
- Scale the x and y axes using xlim and ylim method.
- To display the figure, use show() method.
Example
from matplotlib import pyplot as plt
plt.rcParams["figure.figsize"] = [7.00, 3.50]
plt.rcParams["figure.autolayout"] = True
fig, ax = plt.subplots()
ax.scatter(-1, 1)
ax.annotate("default color", xy=(-0.9, 1))
ax.scatter(1, 1, c='#1f77b4')
ax.annotate("using hex", xy=(1.1, 1))
ax.set_xlim(-2, 3)
ax.set_ylim(-1, 2)
plt.show()
Output

Updated on: 2021-05-15T12:23:40+05:30
5K+ Views

Advertisements