
 Data Structure
 Networking
 RDBMS
RDBMS Operating System
 Java
Java MS Excel
 iOS
iOS HTML
HTML CSS
CSS Android
 Python
 C Programming
 C++
C++ C#
C# MongoDB
 MySQL
MySQL Javascript
 PHP
PHP
- Selected Reading
- UPSC IAS Exams Notes
- Developer's Best Practices
- Questions and Answers
- Effective Resume Writing
- HR Interview Questions
- Computer Glossary
- Who is Who
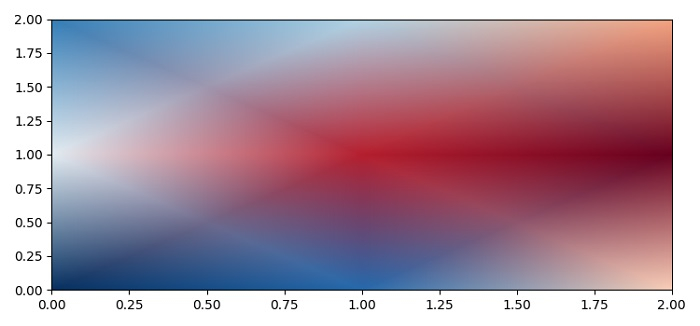
How to get smooth interpolation when using pcolormesh (Matplotlib)?
To get smooth interpolation when using pcolormesh, we can use shading="gouraud" class by name.
Steps
Set the figure size and adjust the padding between and around the subplots.
Create data, x and y using numpy meshgrid.
Create a pseudocolor plot with a non-regular rectangular grid using pcolormesh() method.
To display the figure, use show() method.
Example
import matplotlib.pylab as plt
import numpy as np

plt.rcParams["figure.figsize"] = [7.50, 3.50]
plt.rcParams["figure.autolayout"] = True

data = np.random.random((3, 3))
x = np.arange(0, 3, 1)
y = np.arange(0, 3, 1)
x, y = np.meshgrid(x, y)

plt.pcolormesh(x, y, data, cmap='RdBu', shading='gouraud')

plt.show()
Output

Updated on: 2021-06-03T13:29:34+05:30
2K+ Views

Advertisements