
Article Categories
- All Categories
-
 Data Structure
-
 Networking
-
 RDBMS
RDBMS
-
 Operating System
-
 Java
Java
-
 MS Excel
-
 iOS
iOS
-
 HTML
HTML
-
 CSS
CSS
-
 Android
-
 Python
-
 C Programming
-
 C++
C++
-
 C#
C#
-
 MongoDB
-
 MySQL
MySQL
-
 Javascript
-
 PHP
PHP
Selected Reading
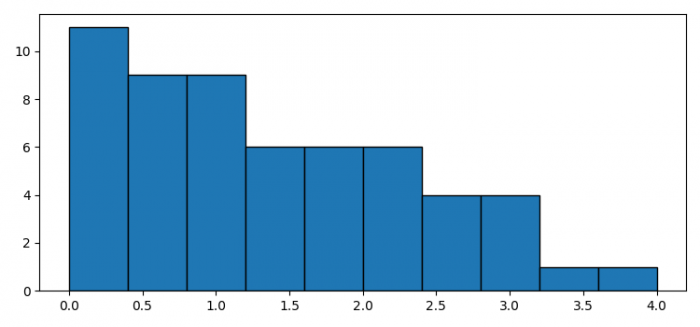
How to get a reverse-order cumulative histogram in Matplotlib?
To get a reverse-order cumulative histogram in Matplotlib, we can use cumulative = -1 in the hist() method.
- Set the figure size and adjust the padding between and around the subplots.
- Make a list of data points.
- Plot a histogram with data and cumulative = -1.
- To display the figure, use show() method.
Example
from matplotlib import pyplot as plt

plt.rcParams["figure.figsize"] = [7.50, 3.50]
plt.rcParams["figure.autolayout"] = True

data = [1, 2, 2, 3, 1, 4, 3, 0, 1, 3, 0]

plt.hist(data, edgecolor='black', align="mid", cumulative=-1)

plt.show()
Output

Updated on: 2021-07-07T10:57:25+05:30
2K+ Views

Advertisements