
Article Categories
- All Categories
-
 Data Structure
-
 Networking
-
 RDBMS
RDBMS
-
 Operating System
-
 Java
Java
-
 MS Excel
-
 iOS
iOS
-
 HTML
HTML
-
 CSS
CSS
-
 Android
-
 Python
-
 C Programming
-
 C++
C++
-
 C#
C#
-
 MongoDB
-
 MySQL
MySQL
-
 Javascript
-
 PHP
PHP
Selected Reading
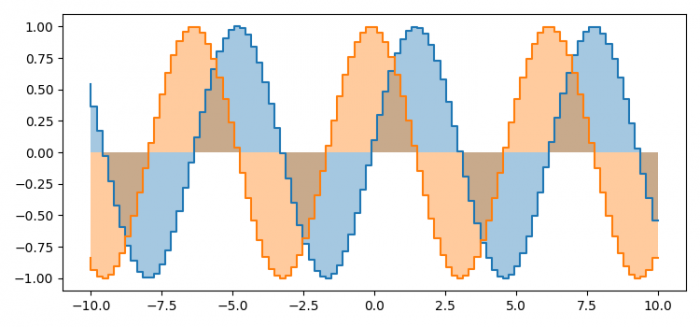
How to fill the area under a step curve using pyplot? (Matplotlib)
To fill the area under step curve using pyplot, we can take the following steps
Steps
- Set the figure size and adjust the padding between and around the subplots.
- Ceate random data points, x, y1 and y2, using numpy.
- To fill the area under the curve, put x and y with ste="pre", using fill_between() method.
- Plot (x, y1) and (x, y2) lines using plot() method with drawstyle="steps" method.
- To display the figure, use show() method.
Example
import matplotlib.pyplot as plt
import numpy as np

plt.rcParams["figure.figsize"] = [7.50, 3.50]
plt.rcParams["figure.autolayout"] = True

x = np.linspace(-10, 10, 100)
y1 = np.sin(x)
y2 = np.cos(x
plt.fill_between(x, y1, step="pre", alpha=0.4)
plt.fill_between(x, y2, step="pre", alpha=0.4)

plt.plot(x, y1, drawstyle="steps")
plt.plot(x, y2, drawstyle="steps")

plt.show()
Output

Updated on: 2021-06-18T10:45:41+05:30
12K+ Views

Advertisements