
 Data Structure
 Networking
 RDBMS
RDBMS Operating System
 Java
Java MS Excel
 iOS
iOS HTML
HTML CSS
CSS Android
 Python
 C Programming
 C++
C++ C#
C# MongoDB
 MySQL
MySQL Javascript
 PHP
PHP
- Selected Reading
- UPSC IAS Exams Notes
- Developer's Best Practices
- Questions and Answers
- Effective Resume Writing
- HR Interview Questions
- Computer Glossary
- Who is Who
How to embed an interactive Matplotlib plot on a webpage?
To show a plot on a webpage such that the plot could be interactive, we can take the following steps −
- Install Bokeh and import figure, show, and output_file.
- Configure the default output state to generate the output saved to a file when:func:'show' is called.
- Create a new Figure for plotting.
- Render the images loaded from the given URLs.
- Immediately display a Bokeh object or application.
Example
from bokeh.plotting import figure, show, output_file

output_file('image.html')
p = figure(x_range=(0, 1), y_range=(0, 1))

p.image_url(url=['bird.jpg'], x=0, y=1, w=0.8, h=0.6)
show(p)
Output
When we execute the code, it will show the following image on your default browser.
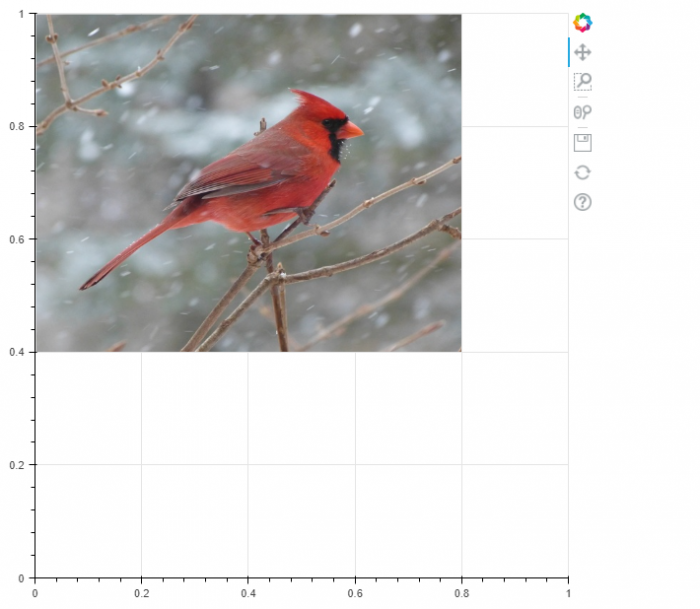
You can move the image around on the browser, as the plot is interactive

Updated on: 2021-06-10T12:00:55+05:30
2K+ Views

Advertisements