
 Data Structure
 Networking
 RDBMS
RDBMS Operating System
 Java
Java MS Excel
 iOS
iOS HTML
HTML CSS
CSS Android
 Python
 C Programming
 C++
C++ C#
C# MongoDB
 MySQL
MySQL Javascript
 PHP
PHP
- Selected Reading
- UPSC IAS Exams Notes
- Developer's Best Practices
- Questions and Answers
- Effective Resume Writing
- HR Interview Questions
- Computer Glossary
- Who is Who
How To Do Break-Even Analysis In Excel?
Businesses employ break?even analysis to estimate the point at which their revenue equals their costs, resulting in neither profit nor loss. It is a fundamental concept in financial management and can provide important insights into the financial viability of a company or a specific product/service. In this article, we'll walk you through the step?by?step process of completing a break?even analysis in Microsoft Excel, one of the most popular spreadsheet programmes. Excel has a number of powerful tools and features that make it an excellent tool for financial analysis, including break?even analysis.
This video will provide you with the information and abilities to perform break?even analysis efficiently, whether you are an entrepreneur wanting to launch a new company, a small business owner evaluating the profitability of a product line, or a student studying finance or accounting. So, let's get started and learn how to use the power of Excel to do break?even analysis, which will provide you with vital insights into the financial health and profitability of your firm!
Do Break?Even Analysis
Here we will first use the formulas, then use the goal?seeking function to complete the task. So let us see a simple process to see how you can do break?even analysis in Excel.
Step 1
Consider an Excel sheet where the data in the sheet is similar to the below image.
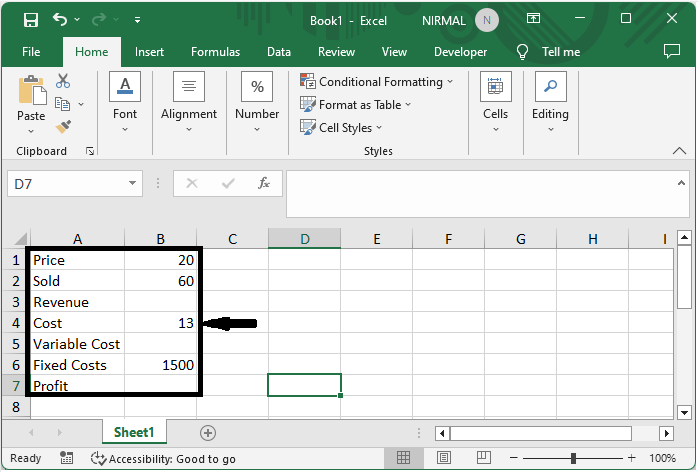
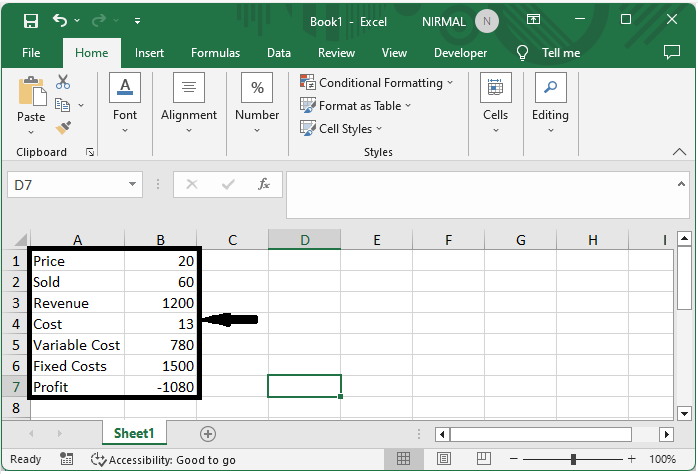
First, enter the formula as =B1*B2, =B2*B4, and =B3?B5?B6 in the B3, B5, and B7 formulas, respectively.
Empty cell > Formula > Enter.
Step 2
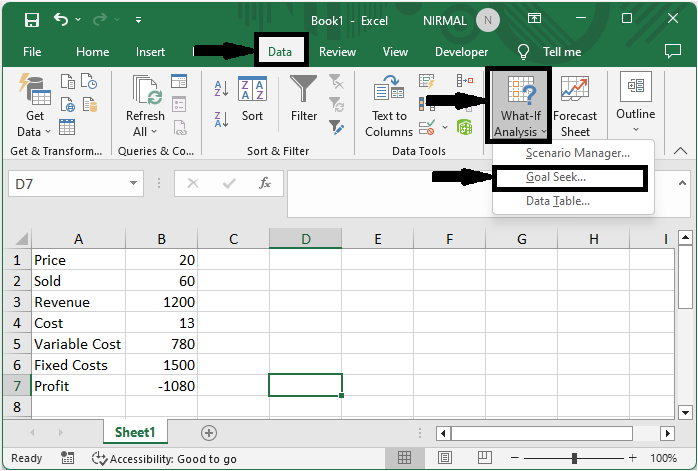
Then click on data, then click on goal seek under what if analysis.
Data > What?if Analysis > Goal Seek.
Step 3
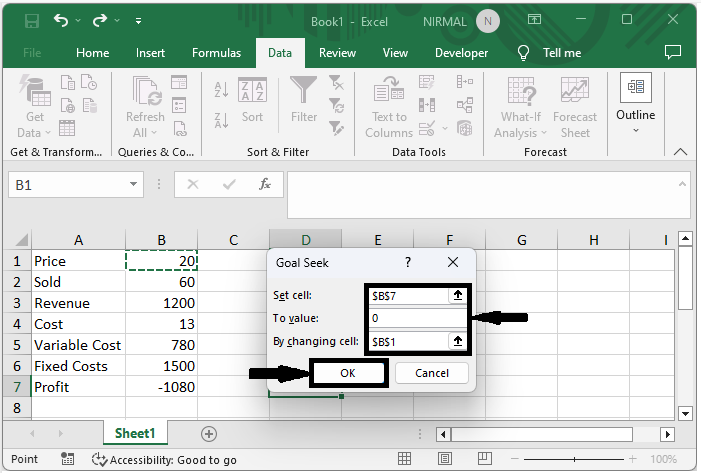
Then enter Set cell as the profit cell location, i.e., $B$7, To value as 0, and By changing the cell to a unit price cell, i.e., cell $B$1, and clicking OK to complete the task,
Set cell > To value > By changing cell > Ok.
Conclusion
In this tutorial, we have used a simple example to demonstrate how you can do break?even analysis in Excel to highlight a particular set of data.

250 Views
