
Article Categories
- All Categories
-
 Data Structure
-
 Networking
-
 RDBMS
RDBMS
-
 Operating System
-
 Java
Java
-
 MS Excel
-
 iOS
iOS
-
 HTML
HTML
-
 CSS
CSS
-
 Android
-
 Python
-
 C Programming
-
 C++
C++
-
 C#
C#
-
 MongoDB
-
 MySQL
MySQL
-
 Javascript
-
 PHP
PHP
-
 Economics & Finance
Selected Reading
How to display star/asterisk sign (*) inside a base R plot?
To display characters inside a base R plot we can simply use text function with expression and if we want to display an asterisk then we need to put the asterisk within double quotes. For example, if we want to display three stars then only expression(paste("***"))) should be used. Check out the below examples to understand how it works.
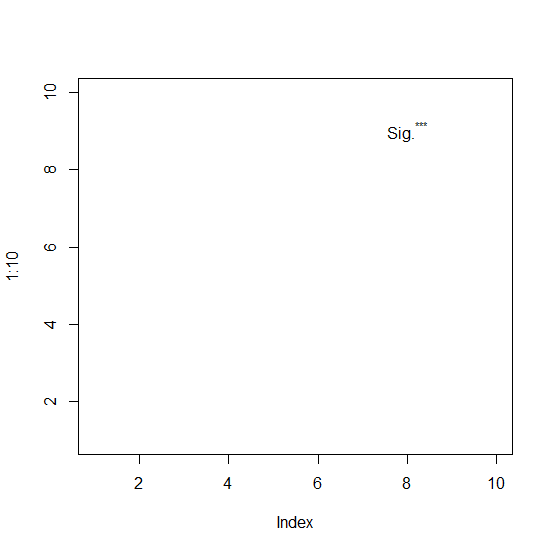
Example1
> plot(1:10,type="n")
> text(8,9,expression(paste(Sig.^"***")))
Output
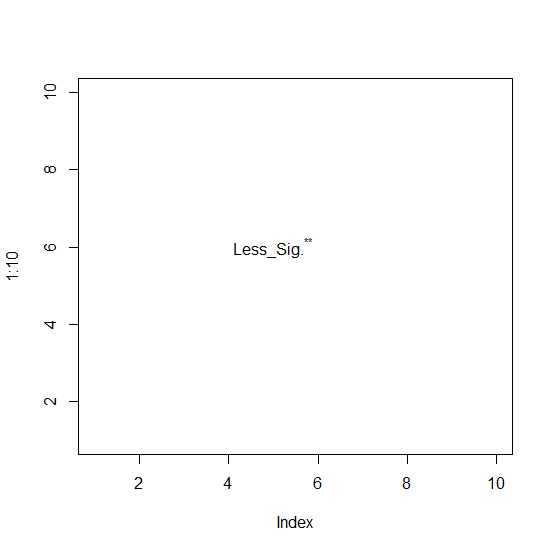
Example2
> plot(1:10,type="n")
> text(5,6,expression(paste(Less_Sig.^"**")))
Output
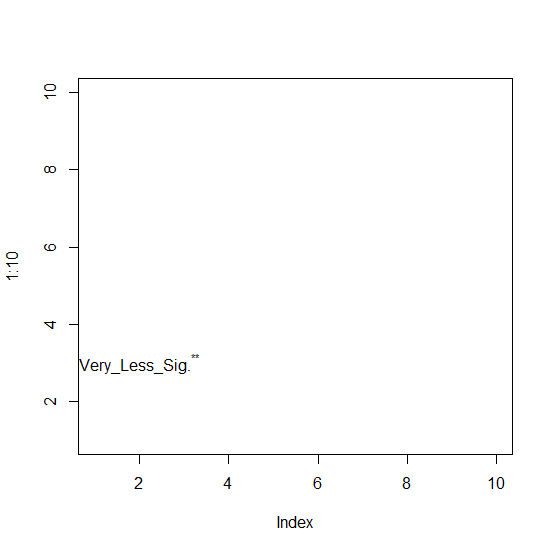
Example3
> plot(1:10,type="n")
> text(2,3,expression(paste(Very_Less_Sig.^"**")))
Output

Updated on: 2020-11-21T06:19:07+05:30
3K+ Views

Advertisements