
Article Categories
- All Categories
-
 Data Structure
-
 Networking
-
 RDBMS
RDBMS
-
 Operating System
-
 Java
Java
-
 MS Excel
-
 iOS
iOS
-
 HTML
HTML
-
 CSS
CSS
-
 Android
-
 Python
-
 C Programming
-
 C++
C++
-
 C#
C#
-
 MongoDB
-
 MySQL
MySQL
-
 Javascript
-
 PHP
PHP
-
 Economics & Finance
Selected Reading
How to display raise to the power on X-axis in base R plot?
To display anything different than the vector or column names on the axes, we need to use xlab for X-axis and ylab for Y-axis. Therefore, if we want to display raise to the power on X-axis then xlab argument will be along with the plot function. For example, if we have a vector called x and we want to create a point chart for x -square with X-axis showing x^2 then it can be done as plot(x^2,xlab="x^2").
Example
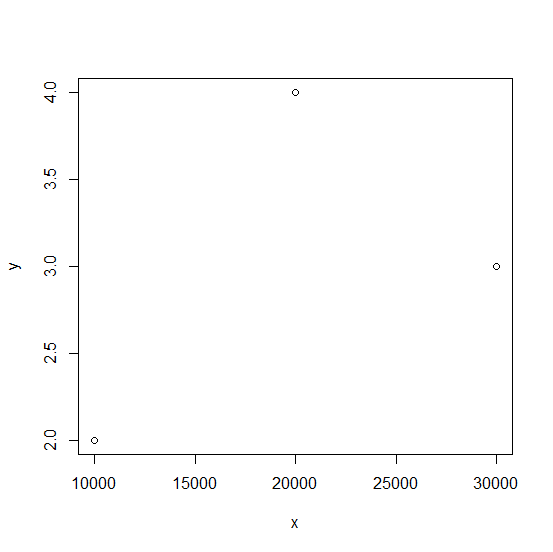
> x<-c(10000,20000,30000)
> y<-rpois(3,2)
> plot(x,y)
Output
Example
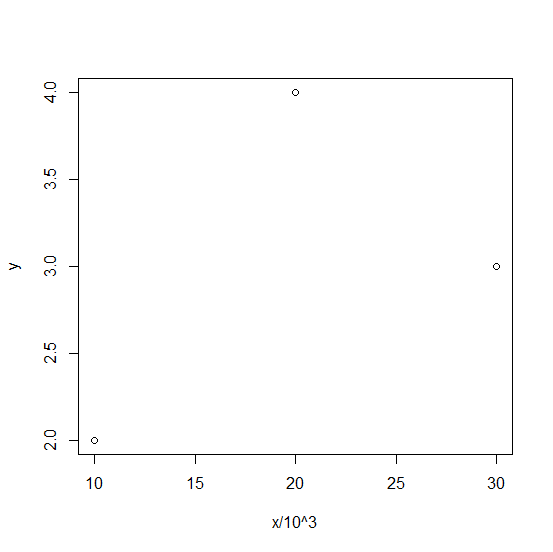
> plot(x/1000,y,xlab="x/10^3")
Output

Updated on: 2021-03-05T06:25:13+05:30
477 Views

Advertisements