
 Data Structure
 Networking
 RDBMS
RDBMS Operating System
 Java
Java MS Excel
 iOS
iOS HTML
HTML CSS
CSS Android
 Python
 C Programming
 C++
C++ C#
C# MongoDB
 MySQL
MySQL Javascript
 PHP
PHP
- Selected Reading
- UPSC IAS Exams Notes
- Developer's Best Practices
- Questions and Answers
- Effective Resume Writing
- HR Interview Questions
- Computer Glossary
- Who is Who
How to create correlation matrix plot in R?
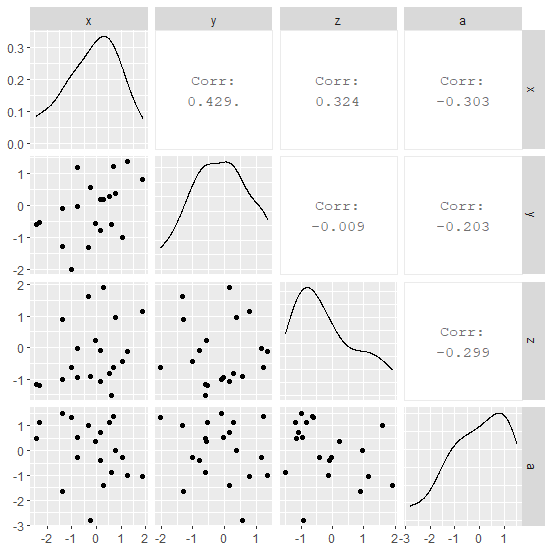
To create a correlation matrix plot, we can use ggpairs function of GGally package. For example, if we have a data frame called df that contains five columns then the correlation matrix plot can be created as ggpairs(df). A correlation matrix plot using ggpairs display correlation value as well as scatterplot and the distribution of variable on diagonal.
Example
Consider the below data frame −
set.seed(212)
x<−rnorm(20)
y<−rnorm(20)
z<−rnorm(20)
a<−rnorm(20)
df<−data.frame(x,y,z,a)
df
Output
     x           y           z        a
1 −0.23917312 0.55113696 −0.92964644 −2.825931332
2 0.67693559 1.21557683 −0.62824719 1.394589909
3 −2.44033601 −0.60781873 −1.16899182 0.484025096
4 1.24088448 1.35475360 −0.12800221 −1.015704678
5 −0.32651441 −1.33758388 1.60649960 1.009938515
6 0.15449093 −0.79244866 −0.09581029 −0.400998378
7 1.03687116 −1.02442868 −0.43375271 −0.293164665
8 −0.77960767 −0.02768991 −0.96182839 0.543345255
9 0.62126406 −0.61268087 −1.50775746 −0.895738801
10 0.29943127 0.16605702 1.90255916 −1.418366917
11 0.15034879 0.17051839 −1.07371818 0.717652086
12 0.50967649 0.26654381 −0.82881794 1.144774784
13 −0.77331482 1.17587680 −0.03197159 −0.257318856
14 1.87566596 0.79978274 1.14677652 −1.052941918
15 0.78830571 0.36352605 0.95455643 0.002662389
16 −2.30671309 −0.52918622 −1.19824723 1.121770768
17 −1.37584147 −1.30278723 0.90339625 −1.637918585
18 −1.02111184 −2.01380274 −0.61700004 1.319289169
19 −1.37921485 −0.10499300 −0.99640769 1.508072921
20 −0.03476825 −0.57019817 0.23396114 0.371342290
Loading GGally package and creating correlation matrix plot −
Example
library(GGally)
ggpairs(df)
Output

Updated on: 2021-02-10T07:14:45+05:30
429 Views

Advertisements