
Article Categories
- All Categories
-
 Data Structure
-
 Networking
-
 RDBMS
RDBMS
-
 Operating System
-
 Java
Java
-
 MS Excel
-
 iOS
iOS
-
 HTML
HTML
-
 CSS
CSS
-
 Android
-
 Python
-
 C Programming
-
 C++
C++
-
 C#
C#
-
 MongoDB
-
 MySQL
MySQL
-
 Javascript
-
 PHP
PHP
-
 Economics & Finance
How to create an image of matrix of pixels in R?
A matrix can be converted into a pixel's image representation in R. This visualization technique displays matrix values as colored pixels, where each matrix element corresponds to a pixel with intensity or color based on its value.
We can create pixel matrix images using R's image() function with the useRaster argument for optimized rendering.
Syntax
image(x, y, z, zlim, xlim, ylim, col, add, xaxs, yaxs, xlab, ylab,
      breaks, oldstyle, useRaster, ...)
Basic Matrix Image Creation
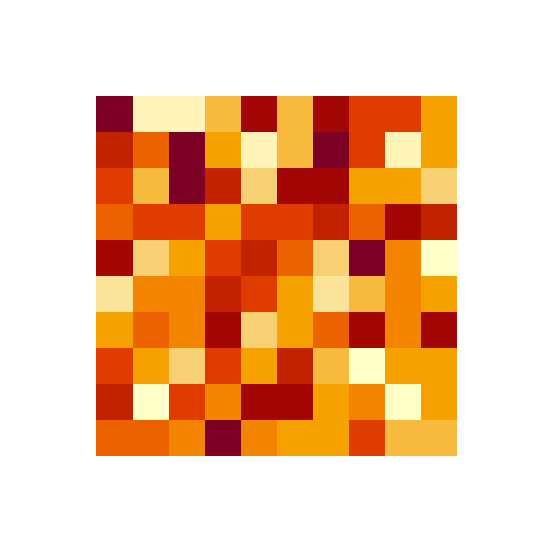
Let's start with a simple 10x10 matrix of random values:
M <- matrix(rnorm(100, 1.5), nrow=10)
par(mar=c(5,5,5,5))
image(M, useRaster=TRUE, axes=FALSE)
Output
Adjusting Margins
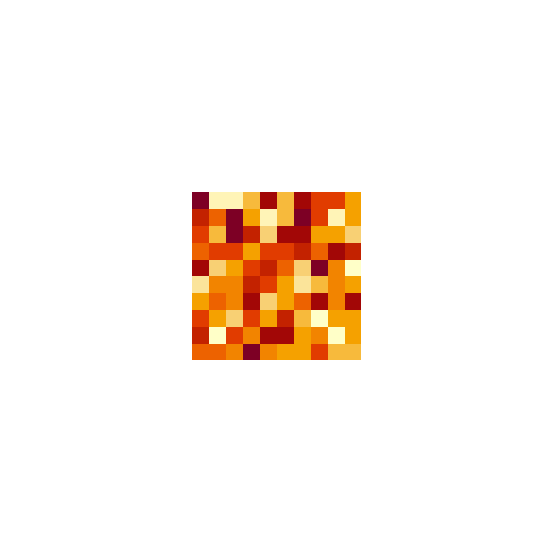
The par(mar=c()) function controls plot margins. Larger values create more spacing around the image:
par(mar=c(10,10,10,10))
image(M, useRaster=TRUE, axes=FALSE)
Output
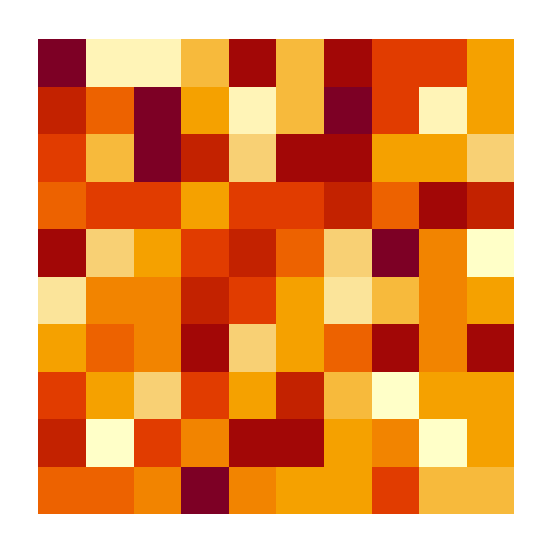
Compact Display
Smaller margin values create a more compact visualization:
par(mar=c(2,2,2,2))
image(M, useRaster=TRUE, axes=FALSE)
Output
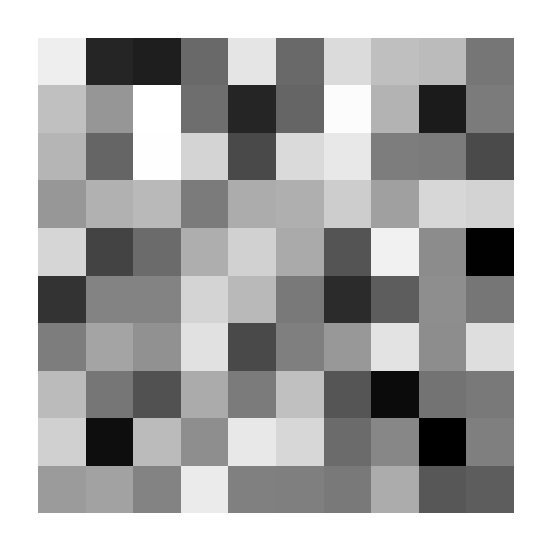
Custom Color Schemes
You can customize the color palette using the col parameter. Here's an example with grayscale colors:
image(M, axes=FALSE, col=grey(seq(0,1,length=180)))
Output
Key Parameters
| Parameter | Description | Example |
|---|---|---|
useRaster |
Optimizes rendering for pixel images | useRaster=TRUE |
axes |
Controls axis display | axes=FALSE |
col |
Color palette for pixel values | col=grey(seq(0,1,length=180)) |
par(mar) |
Sets plot margins (bottom, left, top, right) | par(mar=c(5,5,5,5)) |
Conclusion
The image() function provides an effective way to visualize matrix data as pixel images in R. Use useRaster=TRUE for better performance and customize colors and margins to enhance your visualizations.

1K+ Views
