
Article Categories
- All Categories
-
 Data Structure
-
 Networking
-
 RDBMS
RDBMS
-
 Operating System
-
 Java
Java
-
 MS Excel
-
 iOS
iOS
-
 HTML
HTML
-
 CSS
CSS
-
 Android
-
 Python
-
 C Programming
-
 C++
C++
-
 C#
C#
-
 MongoDB
-
 MySQL
MySQL
-
 Javascript
-
 PHP
PHP
-
 Economics & Finance
Selected Reading
How to create a standard normal distribution curve with 3-sigma limits in R?
A standard normal distribution has mean equals to zero and the standard deviation equals to one. Therefore, when we plot it with three sigma limits, we have six points on the X-axis referring to the plus and minus around zero. If the limits are defined then the plotting can be shown with larger width and that will change the display of the curve. We can do this by creating a sequence for the length of the standard normal variable and its density.
Consider the below vectors corresponding to the limits and density−
x<-seq(-3,3,length=5000)
y<-dnorm(x,mean=0,sd=1)
Example
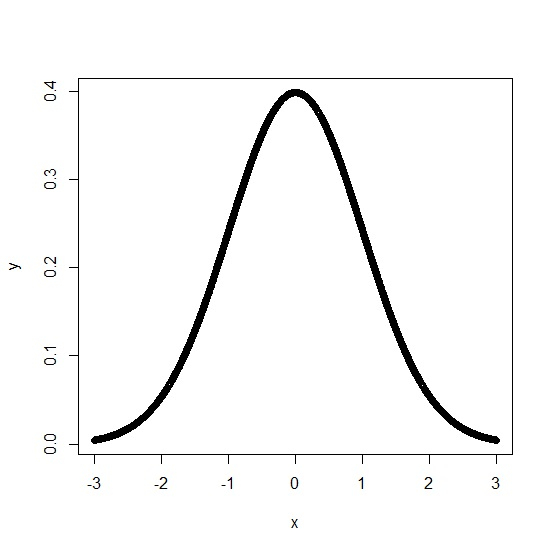
Creating the standard normal distribution curve −
plot(x,y,xlim=c(-3,3))
Output
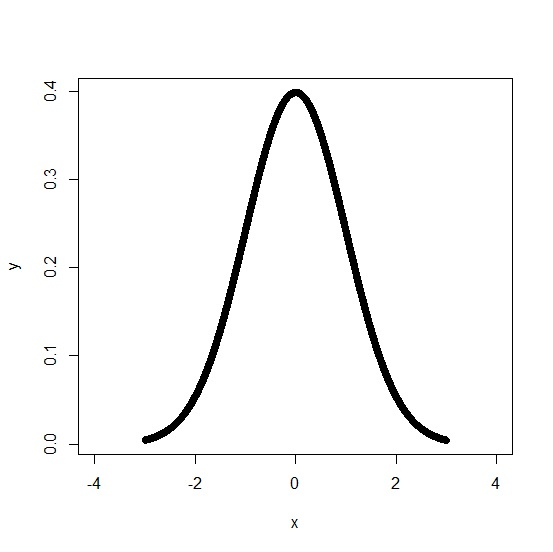
Example
Creating the same plot with larger width −
plot(x,y,xlim=c(-4,4))
Output

Updated on: 2020-10-07T16:29:52+05:30
491 Views

Advertisements