
Article Categories
- All Categories
-
 Data Structure
-
 Networking
-
 RDBMS
RDBMS
-
 Operating System
-
 Java
Java
-
 MS Excel
-
 iOS
iOS
-
 HTML
HTML
-
 CSS
CSS
-
 Android
-
 Python
-
 C Programming
-
 C++
C++
-
 C#
C#
-
 MongoDB
-
 MySQL
MySQL
-
 Javascript
-
 PHP
PHP
Selected Reading
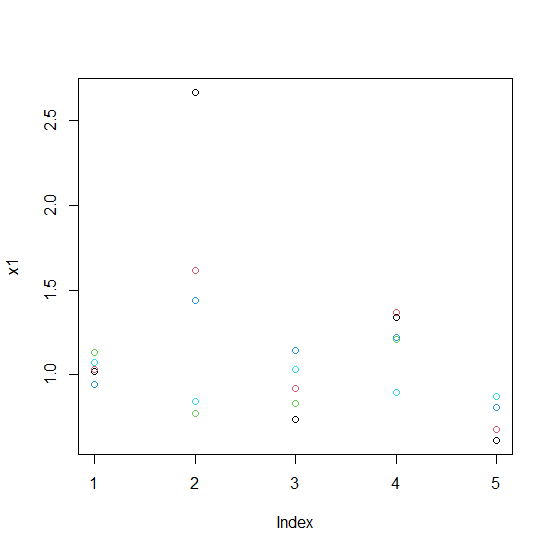
How to create a scatterplot using five vectors in a single plot window without separating the plots in R?
To create more than one scatterplot in a single plot window we should create the scatterplot for first vector and then add the point of the remaining vectors by using points function and they can be displayed with different colors so that it becomes easy to differentiate among the points of the vectors.
Example
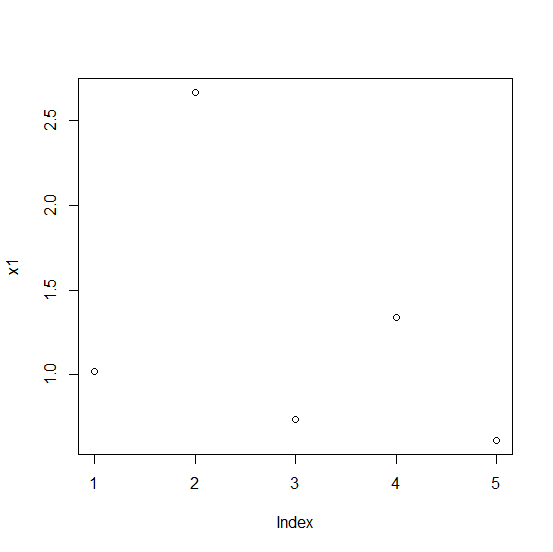
Consider the below vectors −
x1<-rnorm(5,1,0.5)
x2<-rnorm(5,1,0.4)
x3<-rnorm(5,1,0.3)
x4<-rnorm(5,1,0.2)
x5<-rnorm(5,1,0.1)
plot(x1)
Output
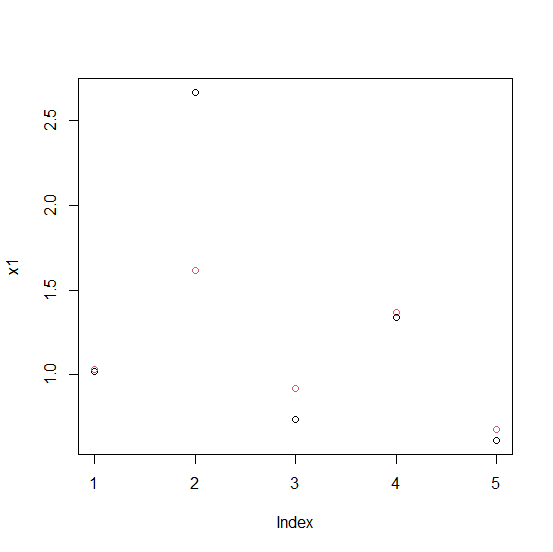
Example
points(x2,col=2)
Output
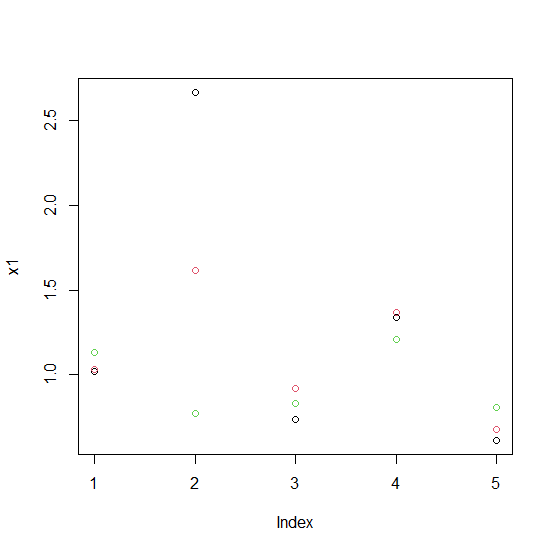
Example
points(x3,col=3)
Output
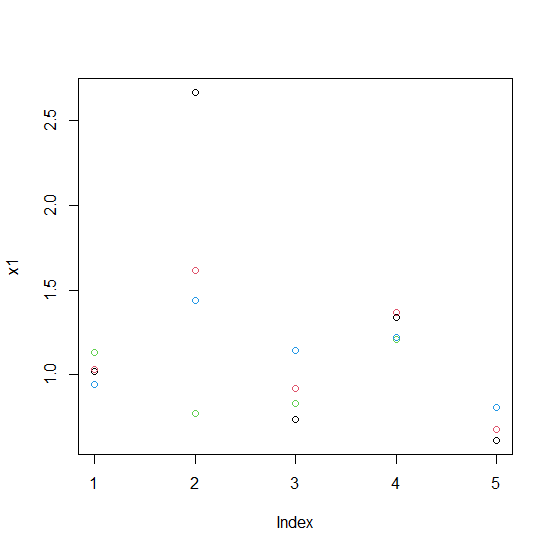
Example
points(x4,col=4)
Output
Example
points(x5,col=5)
Output

Updated on: 2026-03-11T22:50:52+05:30
119 Views

Advertisements