
Article Categories
- All Categories
-
 Data Structure
-
 Networking
-
 RDBMS
RDBMS
-
 Operating System
-
 Java
Java
-
 MS Excel
-
 iOS
iOS
-
 HTML
HTML
-
 CSS
CSS
-
 Android
-
 Python
-
 C Programming
-
 C++
C++
-
 C#
C#
-
 MongoDB
-
 MySQL
MySQL
-
 Javascript
-
 PHP
PHP
-
 Economics & Finance
Selected Reading
How to create a plot of binomial distribution in R?
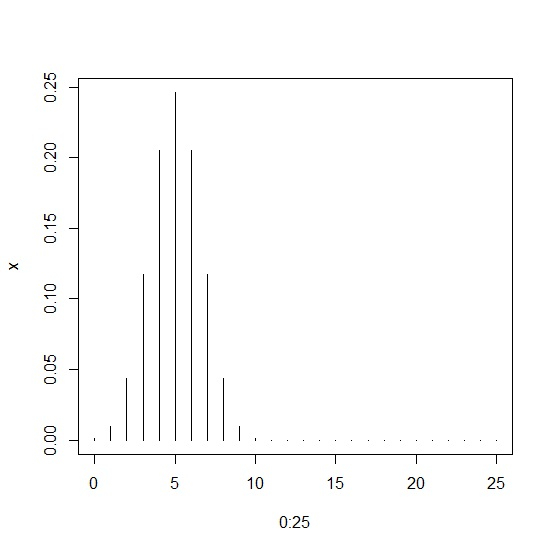
A binomial distribution is based on the distribution of success and failure, the other two parameters of binomial distribution are the sample size and the probability of success. To create a plot of binomial distribution, we first need to define the density of the binomial distribution using dbinom function. The plotting can be done by using plot function with success and the density as shown in the below examples.
Example
xOutput
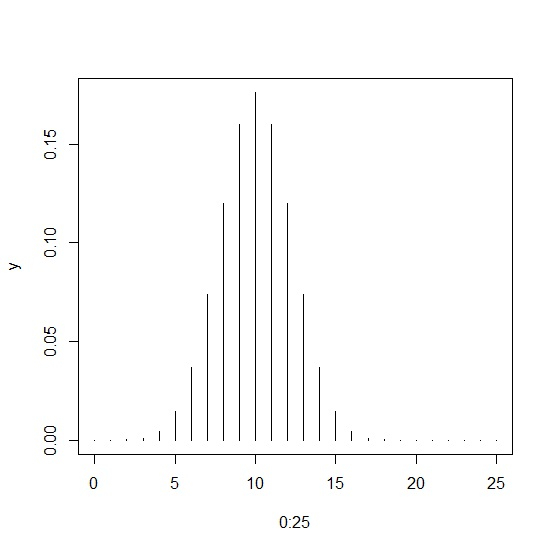
Example
yOutput

Updated on: 2021-02-08T06:24:09+05:30
2K+ Views

Advertisements