
Article Categories
- All Categories
-
 Data Structure
-
 Networking
-
 RDBMS
RDBMS
-
 Operating System
-
 Java
Java
-
 MS Excel
-
 iOS
iOS
-
 HTML
HTML
-
 CSS
CSS
-
 Android
-
 Python
-
 C Programming
-
 C++
C++
-
 C#
C#
-
 MongoDB
-
 MySQL
MySQL
-
 Javascript
-
 PHP
PHP
-
 Economics & Finance
Selected Reading
How to create a histogram with main title in the outer margin of plot window in base R?
The main title of a histogram in base R can be inserted by using title function and if we want to have it in the outer margin then outer argument must be set to TRUE. If the outer argument does not fulfil our requirement then we can use par function to adjust the outer margin area and create the histogram. Check out the below example to understand how it works.
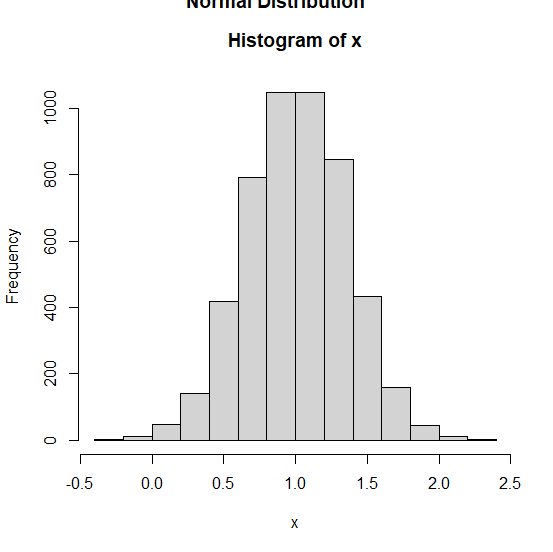
Example
> x<-rnorm(5000,1,0.35)
> hist(x)
> title('Normal Distribution',outer=TRUE)
Output
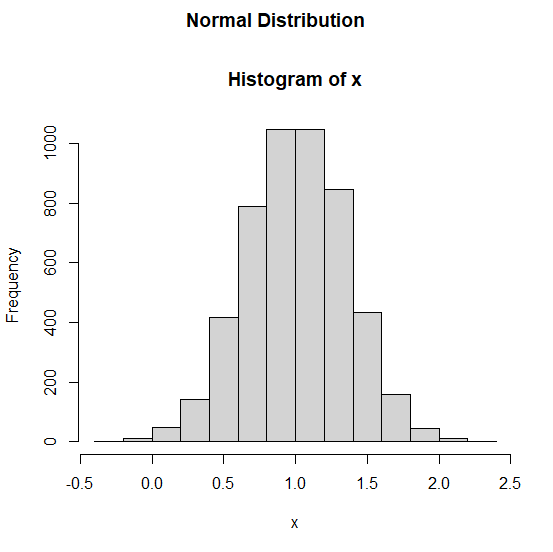
Example
> par(oma=c(0,0,2,0))
> hist(x)
> title('Normal Distribution',outer=TRUE)
Output

Updated on: 2020-11-21T05:43:53+05:30
2K+ Views

Advertisements