
Article Categories
- All Categories
-
 Data Structure
-
 Networking
-
 RDBMS
RDBMS
-
 Operating System
-
 Java
Java
-
 MS Excel
-
 iOS
iOS
-
 HTML
HTML
-
 CSS
CSS
-
 Android
-
 Python
-
 C Programming
-
 C++
C++
-
 C#
C#
-
 MongoDB
-
 MySQL
MySQL
-
 Javascript
-
 PHP
PHP
-
 Economics & Finance
Selected Reading
How to create a dashed line that passes through Y = 1 in base R?
Usually, plots are created with solid lines but sometimes we need to use dashed line so that the points can represent a threshold or something critical, the main objective here is to get the attention of the reader on these points. In base R, the plots are created with plot function and we can use abline function with lty =2 to draw dashed lines.
Example1
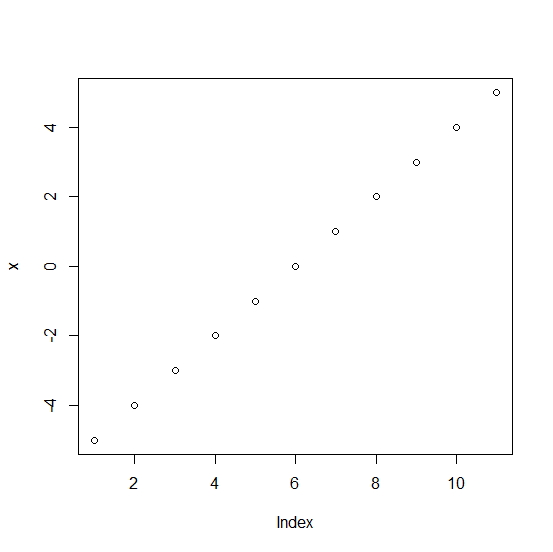
x<−−5:5
x
[1] −5 −4 −3 −2 −1 0 1 2 3 4 5
plot(x)
Output
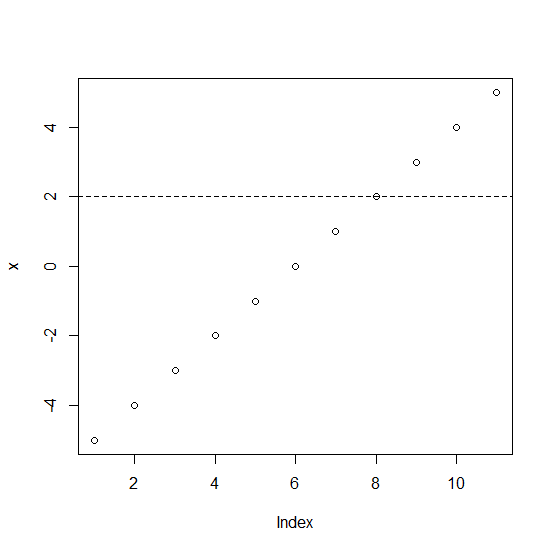
Example
abline(h=2,lty=2)
Output
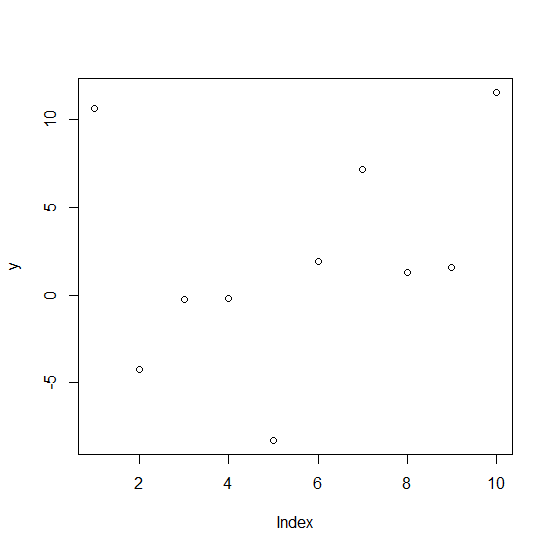
Example
y<−rnorm(10,1,5)
plot(y)
Output
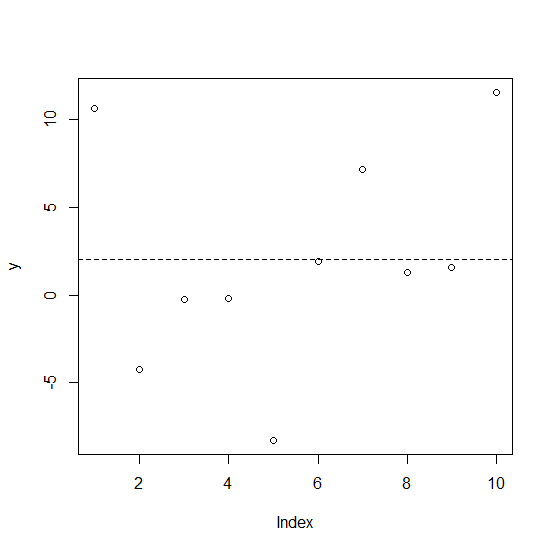
Example
abline(h=2,lty=2)
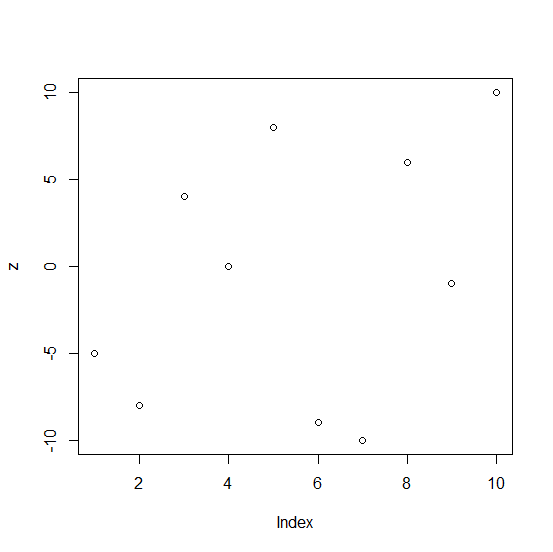
Example3
z<−sample(c(-10:10),10)
z
[1] −5 −8 4 0 8 −9 −10 6 −1 10
plot(z)
Output
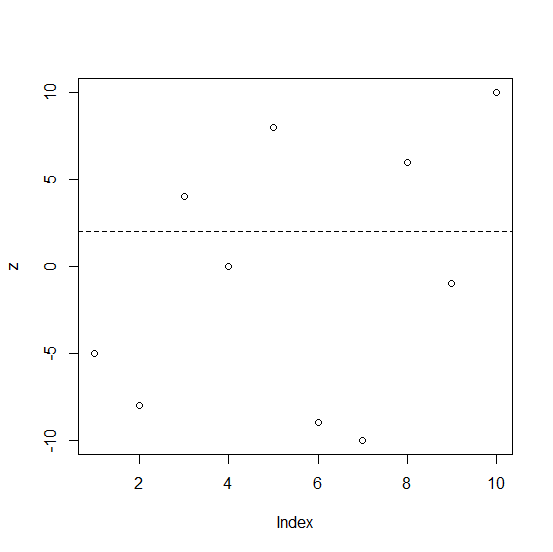
Example
abline(h=2,lty=2)
Output

Updated on: 2026-03-11T22:50:53+05:30
2K+ Views

Advertisements