
 Data Structure
 Networking
 RDBMS
RDBMS Operating System
 Java
Java MS Excel
 iOS
iOS HTML
HTML CSS
CSS Android
 Python
 C Programming
 C++
C++ C#
C# MongoDB
 MySQL
MySQL Javascript
 PHP
PHP
- Selected Reading
- UPSC IAS Exams Notes
- Developer's Best Practices
- Questions and Answers
- Effective Resume Writing
- HR Interview Questions
- Computer Glossary
- Who is Who
How to create a colored box for base R plot?
To create a colored box for base R plot, we can use box function with col argument where we can pass the color other than black because black is the default color.
We first need to create the plot using plot function and then box function will be used as shown in the below given example.
Example
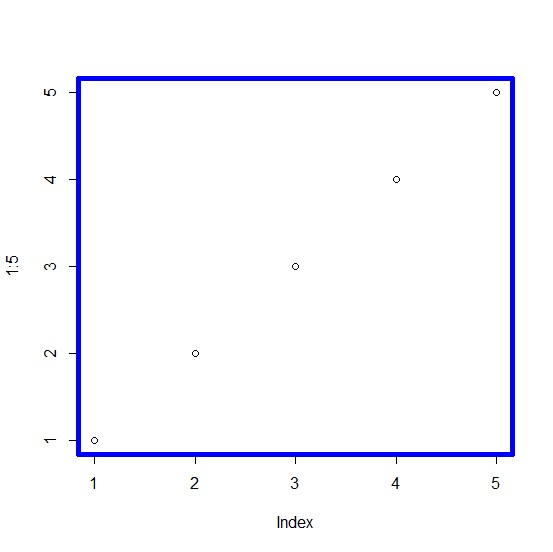
To create a colored box for base R plot, use the following code −
plot(1:5)
box(lwd=5,col="blue")
Output
If you execute the above given code, it generates the following output −
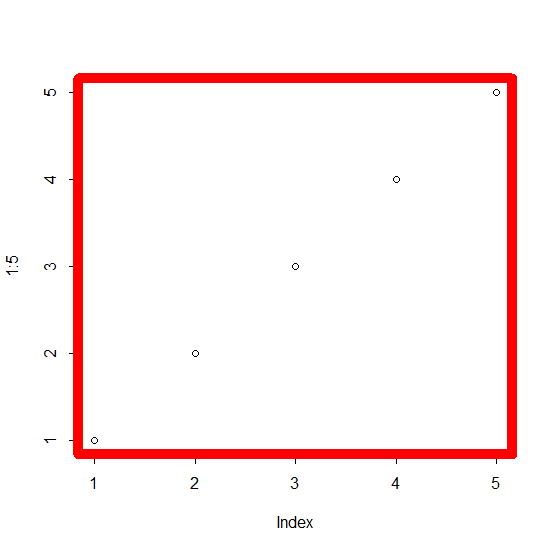
To create a colored box for base R plot, use the following code −
plot(1:5)
box(lwd=10,col="red")
Output
If you execute the above given code, it generates the following output −

Updated on: 2021-11-22T07:29:51+05:30
361 Views

Advertisements