
 Data Structure
 Networking
 RDBMS
RDBMS Operating System
 Java
Java MS Excel
 iOS
iOS HTML
HTML CSS
CSS Android
 Python
 C Programming
 C++
C++ C#
C# MongoDB
 MySQL
MySQL Javascript
 PHP
PHP
- Selected Reading
- UPSC IAS Exams Notes
- Developer's Best Practices
- Questions and Answers
- Effective Resume Writing
- HR Interview Questions
- Computer Glossary
- Who is Who
How to Count Unique Values Between Two Dates in Excel?
Excel is a strong programme with many features and functionalities for manipulating and analysing data. It's frequently required to ascertain the number of unique values inside a given date range when working with huge datasets. Counting unique values between two dates can be a useful tool for data analysis, sales tracking, project progress monitoring, and other tasks. It can also give you important information that can aid in your decision-making.
We'll walk you through the steps of counting unique values between two dates in Excel in this lesson. We'll look at various strategies that make use of built-in functions and methods to help you effectively extract the appropriate data from your datasets. You will have a firm grasp on using Excel's tools to carry out precise and trustworthy unique value counts inside particular date ranges by the end of this session. Let's get going!
Count Unique Values Between Two Dates
Here we will first get the value using the formula, then use the autofill handle to complete the task. So let us see a simple process to learn how you can count unique values between two dates in Excel.
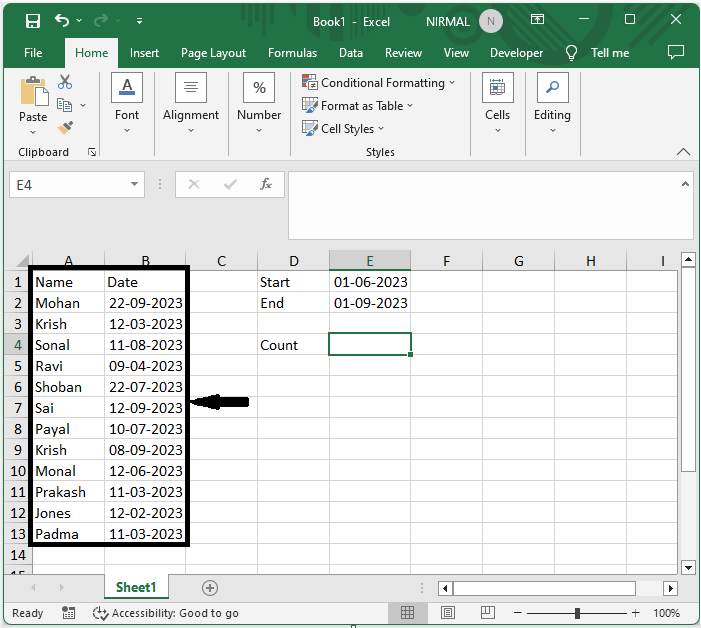
Consider an Excel sheet where the data in the sheet is similar to the below image.
First, click on an empty cell, in this case cell E4, and enter the formula as =SUMPRODUCT(IF((B2:B13<=E2)*(B2:B13>=E1),1/COUNTIFS(B2:B13,"<="&E2,B2:B13,">="&E1,A2:A13,A2:A13),0)), and click Ctrl + Shift + Enter to get the first value.
Empty Cell > Formula > Ctrl + Shift + Enter.
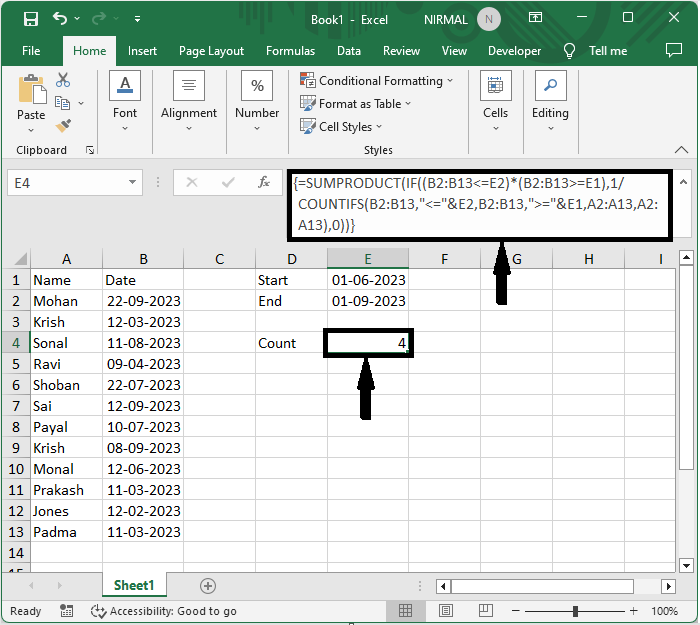
In the formula B2:B13, the range of cells is B2, E1 is the start date, and E2 is the end date. This is how you can count unique values between two dates in Excel.
Conclusion
In this tutorial, we have used a simple example to demonstrate how you can count unique values between two dates in Excel to highlight a particular set of data.

2K+ Views
