
 Data Structure
 Networking
 RDBMS
RDBMS Operating System
 Java
Java MS Excel
 iOS
iOS HTML
HTML CSS
CSS Android
 Python
 C Programming
 C++
C++ C#
C# MongoDB
 MySQL
MySQL Javascript
 PHP
PHP
- Selected Reading
- UPSC IAS Exams Notes
- Developer's Best Practices
- Questions and Answers
- Effective Resume Writing
- HR Interview Questions
- Computer Glossary
- Who is Who
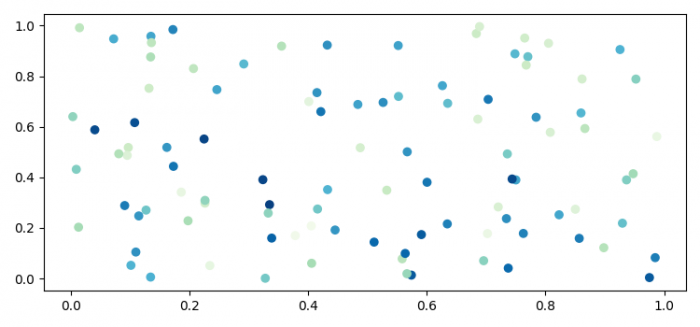
How to convert data values into color information for Matplotlib?
To convert data values into color information for Matplotlib, we can take the following steps −
- Set the figure size and adjust the padding between and around the subplots.
- Get a colormap instance, defaulting to rc values if *name* is None.
- Create random values that could be converted into color information.
- Create random data points, x and y.
- Use scatter() method to plot x and y.
- To display the figure, use show() method.
Example
import numpy as np
import matplotlib.pyplot as plt

plt.rcParams["figure.figsize"] = [7.50, 3.50]
plt.rcParams["figure.autolayout"] = True

plasma = plt.get_cmap('GnBu_r')
values = np.random.rand(100)

x = np.random.rand(len(values))
y = np.random.rand(len(values))

sc = plt.scatter(x, y, c=[plasma(val) for val in values])

plt.show()
Output

Updated on: 2021-06-03T09:46:24+05:30
1K+ Views

Advertisements