
Article Categories
- All Categories
-
 Data Structure
-
 Networking
-
 RDBMS
RDBMS
-
 Operating System
-
 Java
Java
-
 MS Excel
-
 iOS
iOS
-
 HTML
HTML
-
 CSS
CSS
-
 Android
-
 Python
-
 C Programming
-
 C++
C++
-
 C#
C#
-
 MongoDB
-
 MySQL
MySQL
-
 Javascript
-
 PHP
PHP
-
 Economics & Finance
Selected Reading
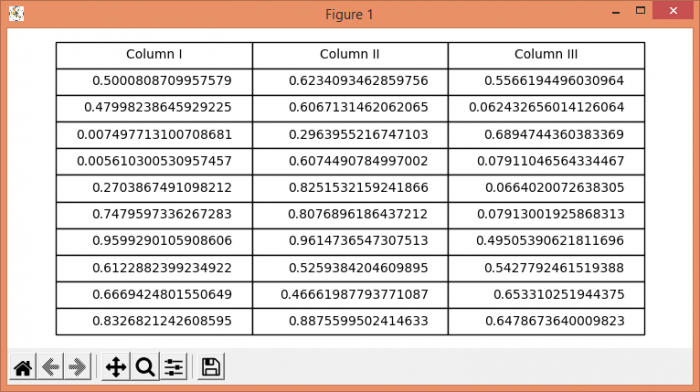
How to change the scale of an existing table in Matplotlib?
To change scale of a table, we can use the scale() method. Steps −
Create a figure and a set of subplots, nrows=1 and ncols=1.
Create a random data using numpy.
Make columns value.
Make the axis tight and off.
Initialize a variable fontsize to change the fontsize.
To set the fontsize of the table and to scale the table, we can use 1.5 and 1.5.
To display the figure, use the show() method.
Example
import numpy as np
from matplotlib import pyplot as plt
plt.rcParams["figure.figsize"] = [7.50, 3.50]
plt.rcParams["figure.autolayout"] = True
fig, axs = plt.subplots(1, 1)
data = np.random.random((10, 3))
columns = ("Column I", "Column II", "Column III")
axs.axis('tight')
axs.axis('off')
fontsize = 10
the_table = axs.table(cellText=data, colLabels=columns, loc='center')
the_table.set_fontsize(fontsize)
the_table.scale(1.5, 1.5)
plt.show()
Output

Updated on: 2021-05-06T13:16:13+05:30
3K+ Views

Advertisements