
Article Categories
- All Categories
-
 Data Structure
-
 Networking
-
 RDBMS
RDBMS
-
 Operating System
-
 Java
Java
-
 MS Excel
-
 iOS
iOS
-
 HTML
HTML
-
 CSS
CSS
-
 Android
-
 Python
-
 C Programming
-
 C++
C++
-
 C#
C#
-
 MongoDB
-
 MySQL
MySQL
-
 Javascript
-
 PHP
PHP
-
 Economics & Finance
Selected Reading
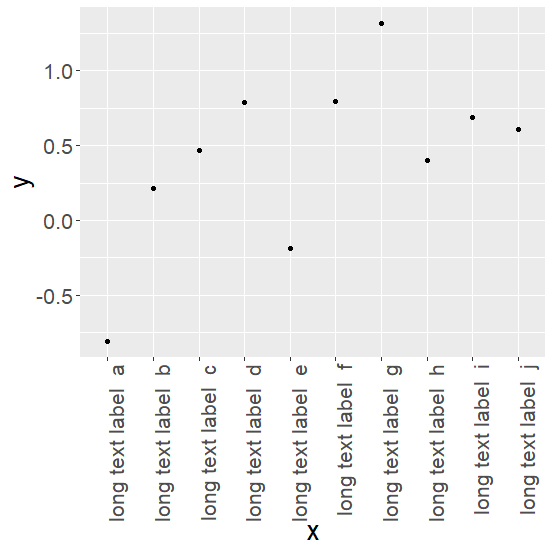
How to change the orientation and font size of x-axis labels using ggplot2 in R?
This can be done by using theme argument in ggplot2
Example
> df <- data.frame(x=gl(10, 1, 10, labels=paste("long text label ", letters[1:10])),
y=rnorm(10,0.5))
> df
        x            y
1 long text label a -0.8080940
2 long text label b 0.2164785
3 long text label c 0.4694148
4 long text label d 0.7878956
5 long text label e -0.1836776
6 long text label f 0.7916155
7 long text label g 1.3170755
8 long text label h 0.4002917
9 long text label i 0.6890988
10 long text label j 0.6077572
Plot is created as follows −
> library(ggplot2)
> ggplot(df, aes(x=x, y=y)) + geom_point() +
   theme(text = element_text(size=20),
      axis.text.x = element_text(angle=90, hjust=1))

Updated on: 2020-07-06T14:53:37+05:30
1K+ Views

Advertisements