
Article Categories
- All Categories
-
 Data Structure
-
 Networking
-
 RDBMS
RDBMS
-
 Operating System
-
 Java
Java
-
 MS Excel
-
 iOS
iOS
-
 HTML
HTML
-
 CSS
CSS
-
 Android
-
 Python
-
 C Programming
-
 C++
C++
-
 C#
C#
-
 MongoDB
-
 MySQL
MySQL
-
 Javascript
-
 PHP
PHP
-
 Economics & Finance
Selected Reading
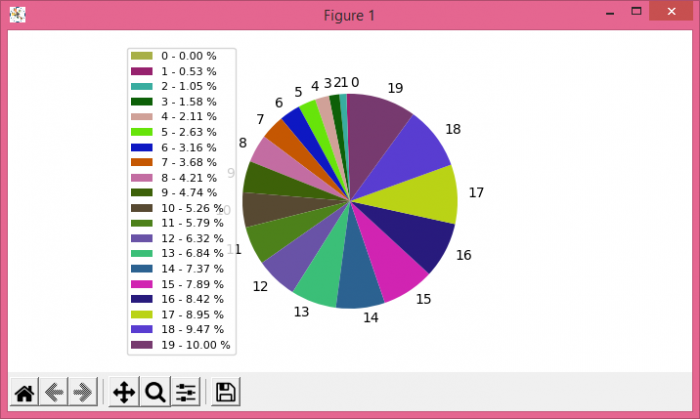
How to avoid overlapping of labels & autopct in a Matplotlib pie chart?
To avoid overlapping of labels and autopct in a matplotlib pie chart, we can follow label as a legend, using legend() method.
Steps
Initialize a variable n=20 to get a number of sections in a pie chart.
Create slices and activities using numpy.
Create random colors using hexadecimal alphabets, in the range of 20.
Use pie() method to plot a pie chart with slices, colors, and slices data points as a label.
Make a list of labels (those are overlapped using autopct).
Use legend() method to avoid overlapping of labels and autopct.
To display the figure, use show() method.
Example
import random
import numpy as np
from matplotlib import pyplot as plt
plt.rcParams["figure.figsize"] = [7.00, 3.50]
plt.rcParams["figure.autolayout"] = True
n = 20
slices = np.arange(n)
activities = np.arange(n)
colors = ["#" + ''.join([random.choice('0123456789ABCDEF') for j in range(6)])
for i in range(n)]

patches, texts = plt.pie(slices,
   colors=colors,
   startangle=90,
   labels=slices)

labels = ['{0} - {1:1.2f} %'.format(i, j) for i, j in zip(activities,
100.*slices/slices.sum())]
plt.legend(patches, labels, loc='center left', bbox_to_anchor=(-0.35, .5), fontsize=8)
plt.show()
Output

Updated on: 2021-05-08T09:10:51+05:30
9K+ Views

Advertisements