
Article Categories
- All Categories
-
 Data Structure
-
 Networking
-
 RDBMS
RDBMS
-
 Operating System
-
 Java
Java
-
 MS Excel
-
 iOS
iOS
-
 HTML
HTML
-
 CSS
CSS
-
 Android
-
 Python
-
 C Programming
-
 C++
C++
-
 C#
C#
-
 MongoDB
-
 MySQL
MySQL
-
 Javascript
-
 PHP
PHP
-
 Economics & Finance
Selected Reading
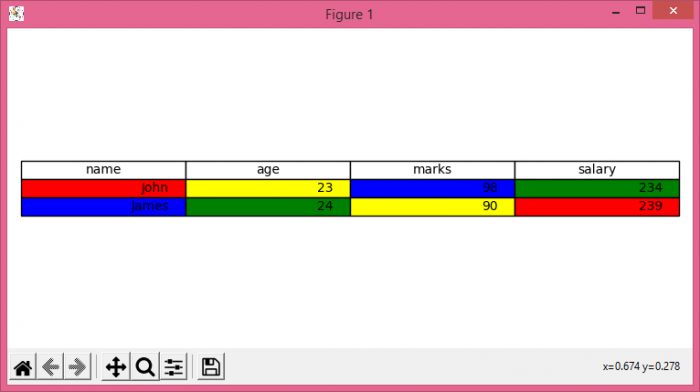
How to assign specific colors to specific cells in a Matplotlib table?
To assign specific colors to specific cells in a Matplotlib table, we can take the following steps −
- Set the figure size and adjust the padding between and around the subplots.
- Make a tuple for columns attribute.
- Make a list of lists, i.e., list of records.
- Make a list of lists, i.e., color of each cell.
- Create a figure and a set of subplots.
- Add a table to an axes ax.
- Turn off the axes.
- To display the figure, use show() method.
Example
import matplotlib.pyplot as plt

plt.rcParams["figure.figsize"] = [7.50, 3.50]
plt.rcParams["figure.autolayout"] = True

columns = ('name', 'age', 'marks', 'salary')

cell_text = [["John", "23", "98", "234"],
["James", "24", "90", "239"]]

colors = [["red", "yellow", "blue", "green"],
["blue", "green", "yellow", "red"]]

fig, ax = plt.subplots()

the_table = ax.table(cellText=cell_text, cellColours=colors,
                     colLabels=columns, loc='center')
ax.axis('off')

plt.show()
Output

Updated on: 2021-06-15T12:28:40+05:30
2K+ Views

Advertisements