
Article Categories
- All Categories
-
 Data Structure
-
 Networking
-
 RDBMS
RDBMS
-
 Operating System
-
 Java
Java
-
 MS Excel
-
 iOS
iOS
-
 HTML
HTML
-
 CSS
CSS
-
 Android
-
 Python
-
 C Programming
-
 C++
C++
-
 C#
C#
-
 MongoDB
-
 MySQL
MySQL
-
 Javascript
-
 PHP
PHP
-
 Economics & Finance
How to Add Up/Down Bars to a Line Chart in Excel?
An up/down chart is one of the frequently used charts in Excel to compare the investments and their returns by a company. The creation of the up/down bars to the lines chart in Excel is a complex process, but in this tutorial, we will show how you can do it in a simple manner.
How to Add Up/Down Bars to a Line Chart in Excel?
Let us see an example to understand how you can add up/down bars to a line chart in Excel.
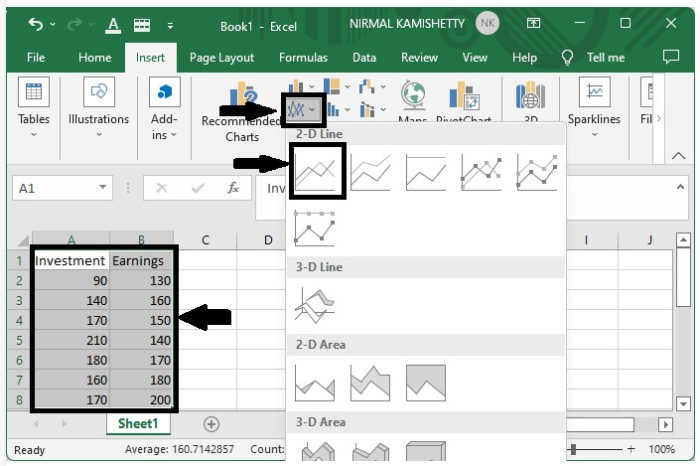
Step 1
First, we need to create a line chart in Excel before adding up down bars to it. To create a line chart, select the data ? click Insert ? select line chart from the chart menu.
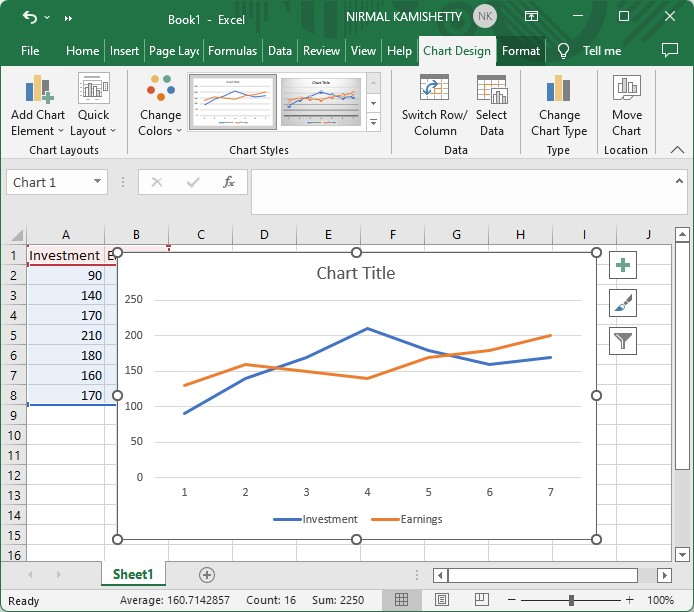
We have successfully created a line chart for the data. Now we have to add the up/down bars to the existing line chart.
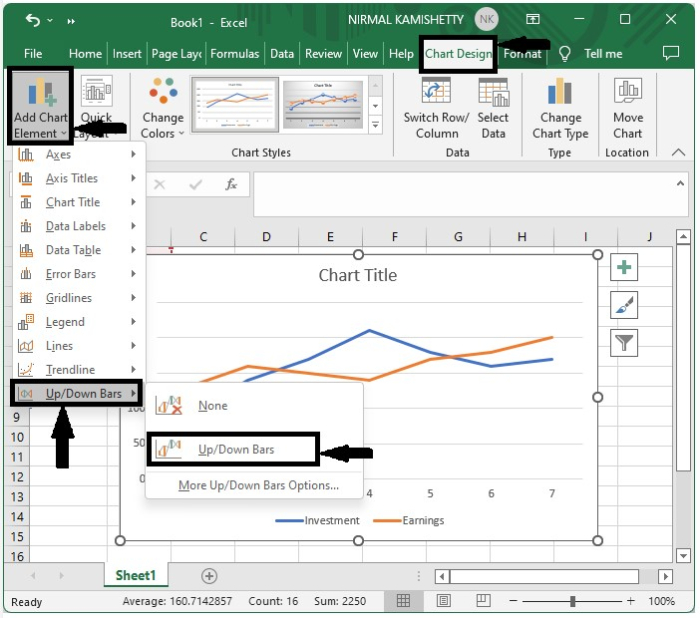
Step 2
Click the chart ? "chart design" in the tool bar ? Add Chart Elements ? Add up/down bars ? select up/down bars, as shown in the below image ?
Step 3
We can customize the format of both up and down bars by right-clicking the required bar.
To format the Up bar, right-click on the Up bar and select "Format Up Bar" to customize the appearance of the Up bar. Then, close the "Format Up Bars" window.
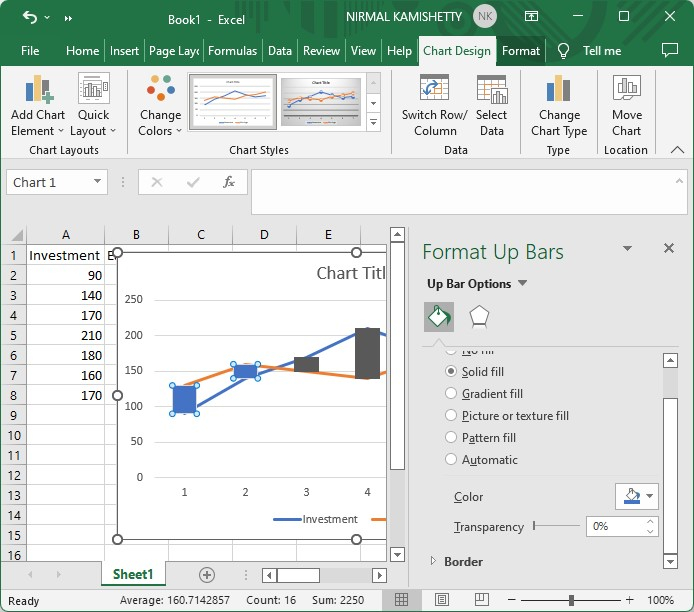
The customization includes selecting the border of the bars and fill colour of the bars. In the same way, we can customize the Down bar.
This is how we can create Up/Down bar for the line graph in Excel.

4K+ Views
