
Article Categories
- All Categories
-
 Data Structure
-
 Networking
-
 RDBMS
RDBMS
-
 Operating System
-
 Java
Java
-
 MS Excel
-
 iOS
iOS
-
 HTML
HTML
-
 CSS
CSS
-
 Android
-
 Python
-
 C Programming
-
 C++
C++
-
 C#
C#
-
 MongoDB
-
 MySQL
MySQL
-
 Javascript
-
 PHP
PHP
Selected Reading
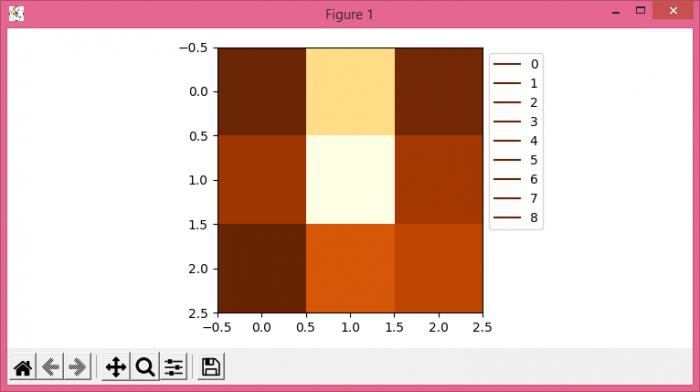
How to add legend to imshow() in Matplotlib?
To add legend to imshow() in Matplotlib, we can take the following steps −
- Set the figure size and adjust the padding between and around the subplots.
- Create random data using numpy.
- Initialize a color map.
- Get the unique data points from sample data, step 2.
- Plot each color with different labels and color, to place on the legend.
- Place a legend at the upper right corner within a box.
- To display the figure, use show() method.
Example
import numpy as np
from matplotlib import pyplot as plt, cm

plt.rcParams["figure.figsize"] = [7.50, 3.50]
plt.rcParams["figure.autolayout"] = True

data = np.random.rand(3, 3)
cmap = cm.YlOrBr
unique_data = np.unique(data)
i = 0

for entry in unique_data:
   mycolor = cmap(entry * 255 / (max(unique_data) - min(unique_data)))
   plt.plot(0, 0, "-", color=mycolor, label="%d"%i)
   i += 1

plt.imshow(data, cmap=cmap)
plt.legend(loc="upper right", bbox_to_anchor=(1.25, 1.0))

plt.show()
Output

Updated on: 2021-06-18T10:38:40+05:30
5K+ Views

Advertisements