
 Data Structure
 Networking
 RDBMS
RDBMS Operating System
 Java
Java MS Excel
 iOS
iOS HTML
HTML CSS
CSS Android
 Python
 C Programming
 C++
C++ C#
C# MongoDB
 MySQL
MySQL Javascript
 PHP
PHP
- Selected Reading
- UPSC IAS Exams Notes
- Developer's Best Practices
- Questions and Answers
- Effective Resume Writing
- HR Interview Questions
- Computer Glossary
- Who is Who
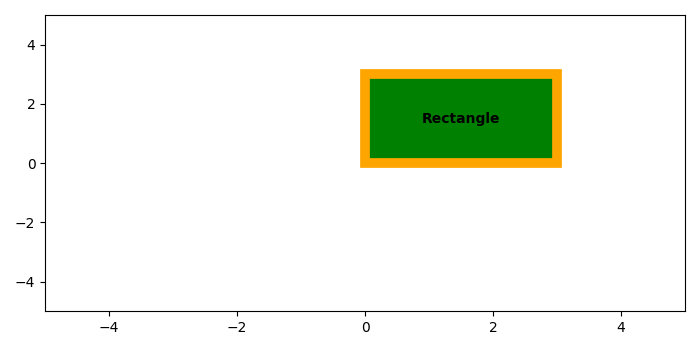
How to add a text into a Rectangle in Matplotlib?
To add a text into a rectangle in matplotlib, we can add a label in annotate method at the center point of the rectangle.
Steps
Create a figure or activate an existing figure using figure() method.
Add a subplot arrangement in the current axis.
To add a rectangle in the plot, use Rectangle() class to get the rectangle object.
Add a rectangle patch on the plot.
To add text label in the rectangle, we can get the center value of the rectangle, i.e., cx and cy.
Use annotate() method to place text on the rectangle.
Limit x and y axes to get a visible rectangle.
To display the figure, use show() method.
Example
from matplotlib import pyplot as plt, patches
plt.rcParams["figure.figsize"] = [7.00, 3.50]
plt.rcParams["figure.autolayout"] = True
fig = plt.figure()
ax = fig.add_subplot(111)
rectangle = patches.Rectangle((0, 0), 3, 3, edgecolor='orange',
facecolor="green", linewidth=7)
ax.add_patch(rectangle)
rx, ry = rectangle.get_xy()
cx = rx + rectangle.get_width()/2.0
cy = ry + rectangle.get_height()/2.0
ax.annotate("Rectangle", (cx, cy), color='black', weight='bold', fontsize=10, ha='center', va='center')
plt.xlim([-5, 5])
plt.ylim([-5, 5])
plt.show()
Output

Updated on: 2021-05-12T12:12:46+05:30
6K+ Views

Advertisements