
 Data Structure
 Networking
 RDBMS
RDBMS Operating System
 Java
Java MS Excel
 iOS
iOS HTML
HTML CSS
CSS Android
 Python
 C Programming
 C++
C++ C#
C# MongoDB
 MySQL
MySQL Javascript
 PHP
PHP
- Selected Reading
- UPSC IAS Exams Notes
- Developer's Best Practices
- Questions and Answers
- Effective Resume Writing
- HR Interview Questions
- Computer Glossary
- Who is Who
How I can get a Cartesian coordinate system in Matplotlib?
To plot a Cartesian coordinate system in matplotlib, we can take the following Steps −
- Initialize a variable (N) with a value.
- Create random data points for x and y.
- Plot the points using scatter method with x and y data points.
- To display the figure, use show() method.
Example
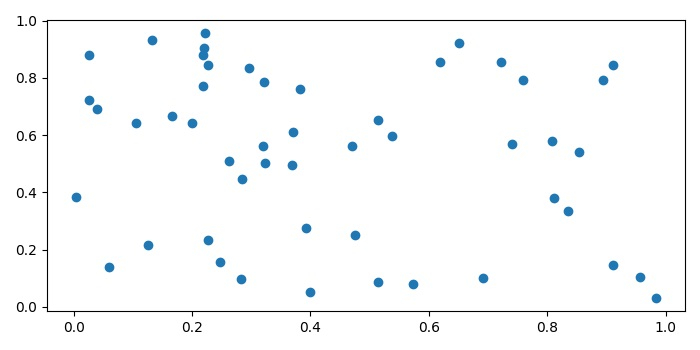
import numpy as np
import matplotlib.pyplot as plt
plt.rcParams["figure.figsize"] = [7.00, 3.50]
plt.rcParams["figure.autolayout"] = True
N = 50
x = np.random.rand(N)
y = np.random.rand(N)
plt.scatter(x, y)
plt.show()
Output

Updated on: 2021-05-15T12:34:21+05:30
891 Views

Advertisements