
Article Categories
- All Categories
-
 Data Structure
-
 Networking
-
 RDBMS
RDBMS
-
 Operating System
-
 Java
Java
-
 MS Excel
-
 iOS
iOS
-
 HTML
HTML
-
 CSS
CSS
-
 Android
-
 Python
-
 C Programming
-
 C++
C++
-
 C#
C#
-
 MongoDB
-
 MySQL
MySQL
-
 Javascript
-
 PHP
PHP
-
 Economics & Finance
Selected Reading
How do I extend the margin at the bottom of a figure in Matplotlib?
To fix the extension of margin at the bottom of a figure, we can take the following steps −
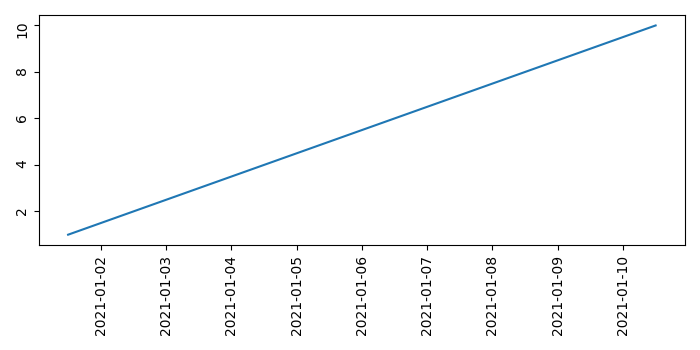
Using Pandas dataframe, create a df with the keys, time and speed.
Plot df.time and df.speed using plot() method.
Tick_params() is a convenience method for changing the appearance of ticks and tick labels. rotation=90 extends the tick labels at the bottom.
To fix the bottom extension, use tight_layout() method.
Example
import numpy as np
import pandas as pd
from matplotlib import pyplot as plt
plt.rcParams["figure.figsize"] = [7.00, 3.50]
plt.rcParams["figure.autolayout"] = True
df = pd.DataFrame(dict(time=list(pd.date_range("2021-01-01 12:00:00",
periods=10)), speed=np.linspace(1, 10, 10)))
plt.plot(df.time, df.speed)
plt.tick_params(rotation=90)
plt.show()
Output

Updated on: 2021-05-06T13:28:47+05:30
849 Views

Advertisements