
Article Categories
- All Categories
-
 Data Structure
-
 Networking
-
 RDBMS
RDBMS
-
 Operating System
-
 Java
Java
-
 MS Excel
-
 iOS
iOS
-
 HTML
HTML
-
 CSS
CSS
-
 Android
-
 Python
-
 C Programming
-
 C++
C++
-
 C#
C#
-
 MongoDB
-
 MySQL
MySQL
-
 Javascript
-
 PHP
PHP
How to Adjust the Position of a Matplotlib Colorbar?
Adjusting the position of the Matplotlib colorbar is essential for producing precise and comprehensible graphs and plots. This article describes some common methods for adjusting the position of a Matplotlib colorbar. Colorbars are crucial to understanding the significance of a subplot or plot. Sometimes, colorbars can overlap with other elements of the plot, making it difficult for the accurate interpretation of data. We will be discussing two methods for modifying the position of a Matplotlib colorbar which will include the use of pad, aspect, and reduce parameters.
Matplotlib
Matplotlib is a library that is mainly used for plotting graphs and plots for the Python programming language and NumPy, its extension for numerical mathematics. Tkinter, wxPython, Qt, and GTK GUI toolkits may include diagrams utilizing its object-oriented API. The matplotlib.pyplot is a collection of command-style methods that allow matplotlib to function similarly to MATLAB. Each pyplot function alters a figure in some manner, whether it is by adding a plotting area, plotting lines, adding labels, etc.
Pyplot is a submodule of the Python matplotlib utility. It is a Python library containing a collection of functions and methods for plotting 2D graphs.
Colorbar
A colorbar is a horizontal bar that extends along the side of a Matplotlib chart and serves as a legend for the colors displayed in the chart. The colorbar() function in the pyplot module of matplotlib adds a color scale bar to a plot. Matplotlib provides extensive colorbar customization options. The colorbar is an instance of plt.Axes, so all of the axes and mark formatting techniques are applicable. We can narrow the color limits and designate the out-of-bounds values with a triangular arrow at the top and bottom of the colorbar by setting the extend property.
Syntax
matplotlib.pyplot.colorbar(mappable=None, cax=None, ax=None)
Explanation
mappable ? It sets the default to the current image but by default its value is None.
cax ? It defines the axis in which colorbar will be drawn.
ax ? Parent axes are taken from to make room for a new colorbar axis. If a list of axes is given, they are shrunk to make room for colorbar axes.
Adjust the position of a Matplotlib colorbar
There are mainly three methods for adjusting the position of a matplotlib colorbar and we will see all four positions that are left right, bottom, and top, they are ?
Method 1 ? Using pad and aspect parameters.
Method 2 ? Using location argument and cax parameter.
Method 3 ? Using the cax parameter.
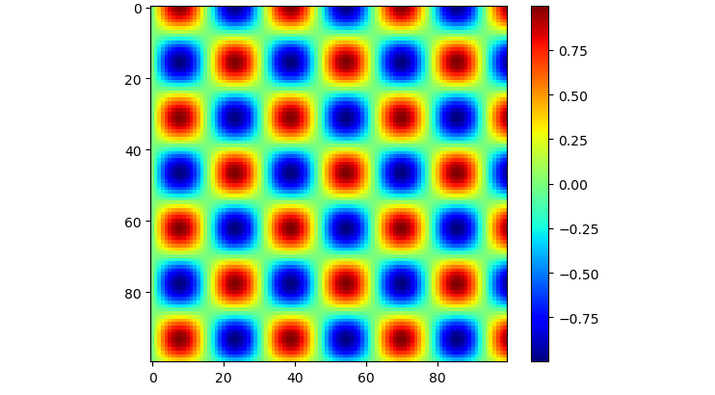
By default, the colorbar is on the left. Let?s look at an example of a normal colorbar.
Example
import matplotlib.pyplot as p
import numpy as n

# generate some data
x = n.linspace(0, 20, 100)
y = n.linspace(0, 20, 100)
X, Y = n.meshgrid(x, y)
Z = n.sin(X) * n.cos(Y)

# create a horizontal subplot and plot the data
f, a = p.subplots()
i = a.imshow(Z, cmap='jet')

# add a colorbar and adjust the position
cbar = fig.colorbar(i, ax=a)

# display the plot
p.show()
Output
Using pad and aspect parameters
The pad parameter lets us change how far away the colorbar is from the plot. The aspect parameter sets the size of the colorbar in terms of its width and height. By changing these parameters, we can change where the colorbar is.
For example, we can use the following code to change where the colorbar is in a horizontal subplot, here colorbar position is below the graph ?
The colorbar is the line that represents the line that has colors that are shown in the graph so in this example we will see how we can set the position of the colorbar below the graph with the help of pad parameter and the orientation parameter where the value of the parameter orientation will be horizontal.
Example
import matplotlib.pyplot as p
import numpy as n

# generate some data
x = n.linspace(0, 20, 100)
y = n.linspace(0, 20, 100)
X, Y = n.meshgrid(x, y)
Z = n.sin(X) * n.cos(Y)

# create a horizontal subplot and plot the data
f, a = p.subplots()
i = a.imshow(Z, cmap='jet')

# add a colorbar and adjust the position
cbar = fig.colorbar(i, ax=a, orientation='horizontal', pad=0.3, aspect=35)

# display the plot
p.show()
Output
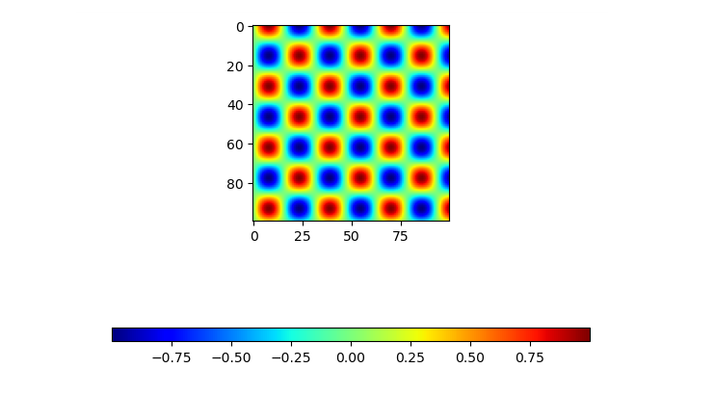
In the above program, we have plotted the data using ax.imshow() and created a horizontal subplot. After that, we added a colorbar using the function f.colorbar() and adjusted its position using the pad and aspect parameters.
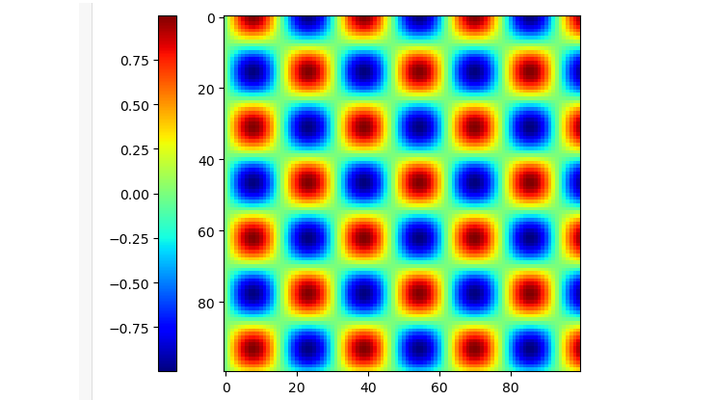
Using location parameter
The axes' positions are specified by the user, and the colorbar is associated with the currently displayed axis by means of the "location"parameter. When coloring multiple axes in a list, the location argument is used on the color bars.
Example
import matplotlib.pyplot as p
import numpy as n

# generate some data
x = n.linspace(0, 20, 100)
y = n.linspace(0, 20, 100)
X, Y = n.meshgrid(x, y)
Z = n.sin(X) * n.cos(Y)

# create a horizontal subplot and plot the data
f, a = p.subplots()
i = a.imshow(Z, cmap='jet')

# add a colorbar and adjust the position
cbar = fig.colorbar(i, ax = [a], location = 'left')

# display the plot
p.show()
Output
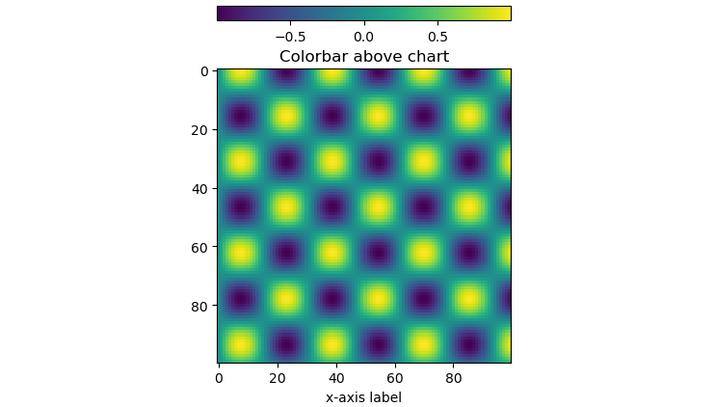
Using the cax parameter
It defines the axis to which colorbar will be drawn.
Below is the program to set the position of colorbar to the top.
Example
import matplotlib.pyplot as p

from mpl_toolkits.axes_grid1 import make_axes_locatable
import numpy as n

# generate some data
x = n.linspace(0, 20, 100)

y = n.linspace(0, 20, 100)
X, Y = n.meshgrid(x, y)
Z = n.sin(X) * n.cos(Y)
# create chart
fig, ax = p.subplots()
im = ax.imshow(Z)
ax.set_xlabel('x-axis label')
ax.set_title('Colorbar above chart')

# add color bar below chart
divider = make_axes_locatable(ax)
cax = divider.new_vertical(size = '5%', pad = 0.5)
fig.add_axes(cax)
fig.colorbar(im, cax = cax, orientation = 'horizontal')

plt.show()
Output
Conclusion
In conclusion, adjusting a Matplotlib colorbar is a key part of making plots that are clear and accurate. We have learned that we can move the colorbar in a plot or subplot by using different parameters, such as pad, location, and cax, depending on what we need.

3K+ Views
