
Article Categories
- All Categories
-
 Data Structure
-
 Networking
-
 RDBMS
RDBMS
-
 Operating System
-
 Java
Java
-
 MS Excel
-
 iOS
iOS
-
 HTML
HTML
-
 CSS
CSS
-
 Android
-
 Python
-
 C Programming
-
 C++
C++
-
 C#
C#
-
 MongoDB
-
 MySQL
MySQL
-
 Javascript
-
 PHP
PHP
-
 Economics & Finance
Selected Reading
How can I plot a histogram such that the heights of the bars sum to 1 in matplotlib?
In plt.hist() method, stacked=True could help to get the heights of the bars sum to 1.
Steps
Create a list of numbers.
Using plt.hist(), we can draw the histogram.
-
stacked : bool, default: False
If "True", multiple data are stacked on top of each other If ``False`` multiple data are arranged side by side if histtype is 'bar' or on top of each other if histtype is 'step'.
-
density : bool, default: False
If "True", draw and return a probability density: each bin will display the bin's raw count divided by the total number of counts *and the bin width*.
To show the figure, use the plt.show() method.
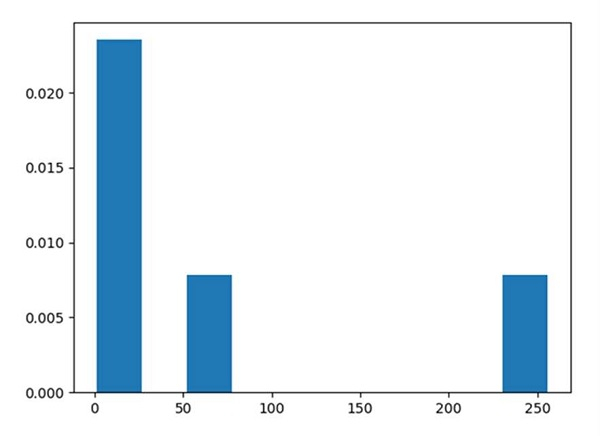
Example
from matplotlib import pyplot as plt

x = [1, 4, 16, 64, 256]

# stacked and density are true then the sum of the histograms is normalized to 1.
plt.hist(x, 10, stacked=True, density=True)
plt.show()
Output

Updated on: 2021-03-16T10:43:44+05:30
681 Views

Advertisements