
 Data Structure
 Networking
 RDBMS
RDBMS Operating System
 Java
Java MS Excel
 iOS
iOS HTML
HTML CSS
CSS Android
 Python
 C Programming
 C++
C++ C#
C# MongoDB
 MySQL
MySQL Javascript
 PHP
PHP
- Selected Reading
- UPSC IAS Exams Notes
- Developer's Best Practices
- Questions and Answers
- Effective Resume Writing
- HR Interview Questions
- Computer Glossary
- Who is Who
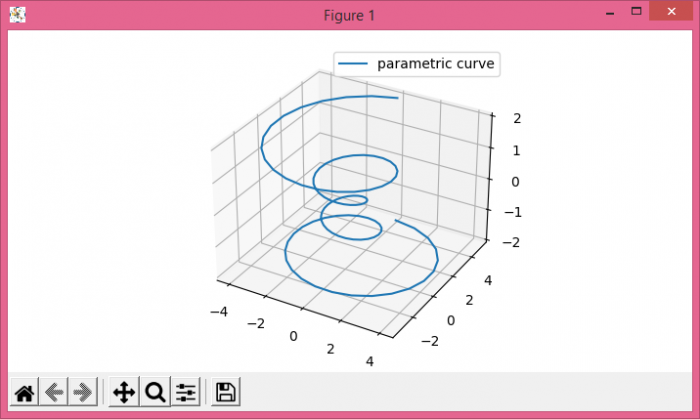
How can I make a simple 3D line with Matplotlib?
To make a simple 3D line with matplotlib, we can take the following steps −
Create a new figure or activate an existing figure.
Add axes to the figure as part of a subplot arrangement.
Create data points for theta, z, r, x and y using numpy.
Plot x, y and z using plot() method.
Place a legend on the figure using legend() method.
To display the figure, use show() method.
Example
import numpy as np
from matplotlib import pyplot as plt
plt.rcParams["figure.figsize"] = [7.00, 3.50]
plt.rcParams["figure.autolayout"] = True
fig = plt.figure()
ax = fig.add_subplot(projection='3d')
theta = np.linspace(-4 * np.pi, 4 * np.pi, 100)
z = np.linspace(-2, 2, 100)
r = z**2 + 1
x = r * np.sin(theta)
y = r * np.cos(theta)
ax.plot(x, y, z, label="parametric curve")
ax.legend()
plt.show()
Output

Updated on: 2021-05-08T08:33:32+05:30
313 Views

Advertisements