
Article Categories
- All Categories
-
 Data Structure
-
 Networking
-
 RDBMS
RDBMS
-
 Operating System
-
 Java
Java
-
 MS Excel
-
 iOS
iOS
-
 HTML
HTML
-
 CSS
CSS
-
 Android
-
 Python
-
 C Programming
-
 C++
C++
-
 C#
C#
-
 MongoDB
-
 MySQL
MySQL
-
 Javascript
-
 PHP
PHP
-
 Economics & Finance
Selected Reading
How can I convert from scatter size to data coordinates in Matplotlib?
To convert from scatter size to data coordinates in Matplotlib, we can take the following steps −
- Set the figure size and adjust the padding between and around the subplots.
- Create x and s data points using numpy.
- Create a figure and a set of subplots.
- Make a scatter plot with X and s, cmap and color info.
- To display the figure, use show() method.
Example
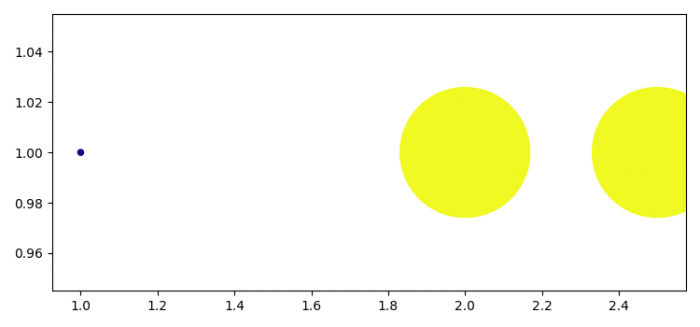
import numpy as np
from matplotlib import pyplot as plt

plt.rcParams["figure.figsize"] = [7.50, 3.50]
plt.rcParams["figure.autolayout"] = True

X = np.array([[1, 1], [2, 1], [2.5, 1]])
s = np.array([20, 10000, 10000])

fig, ax = plt.subplots()

ax.scatter(X[:, 0], X[:, 1], s=s, cmap='plasma', c=s)

plt.show()
Output

Updated on: 2021-06-17T12:03:56+05:30
363 Views

Advertisements