
 Data Structure
 Networking
 RDBMS
RDBMS Operating System
 Java
Java MS Excel
 iOS
iOS HTML
HTML CSS
CSS Android
 Python
 C Programming
 C++
C++ C#
C# MongoDB
 MySQL
MySQL Javascript
 PHP
PHP
- Selected Reading
- UPSC IAS Exams Notes
- Developer's Best Practices
- Questions and Answers
- Effective Resume Writing
- HR Interview Questions
- Computer Glossary
- Who is Who
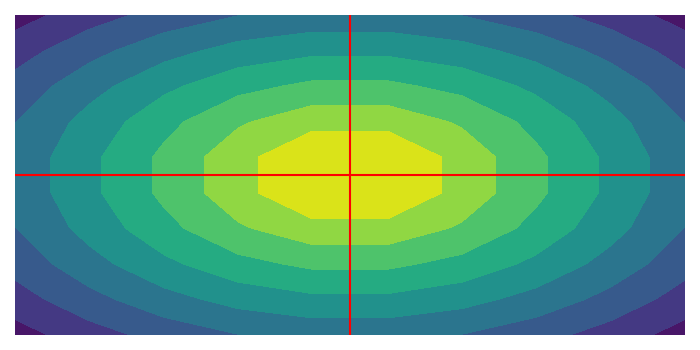
Draw axis lines or the origin for Matplotlib contour plot.
To draw axis lines or the origin for matplotlib contour plot, we can use contourf(), axhline() y=0 and axvline() x=0.
Create data points for x, y, and z using numpy.
To set the axes properties, we can use plt.axis('off') method.
Use contourf() method with x, y, and z data points.
Plot x=0 and y=0 lines with red color.
To display the figure, use show() method.
Example
import numpy as np
import matplotlib.pyplot as plt
plt.rcParams["figure.figsize"] = [7.00, 3.50]
plt.rcParams["figure.autolayout"] = True
x = np.linspace(-1.0, 1.0, 10)
x, y = np.meshgrid(x, x)
z = -np.hypot(x, y)
plt.axis('off')
plt.contourf(x, y, z, 10)
plt.axhline(0, color='red')
plt.axvline(0, color='red')
plt.show()
Output

Updated on: 2021-05-11T12:22:57+05:30
5K+ Views

Advertisements