
Article Categories
- All Categories
-
 Data Structure
-
 Networking
-
 RDBMS
RDBMS
-
 Operating System
-
 Java
Java
-
 MS Excel
-
 iOS
iOS
-
 HTML
HTML
-
 CSS
CSS
-
 Android
-
 Python
-
 C Programming
-
 C++
C++
-
 C#
C#
-
 MongoDB
-
 MySQL
MySQL
-
 Javascript
-
 PHP
PHP
-
 Economics & Finance
Selected Reading
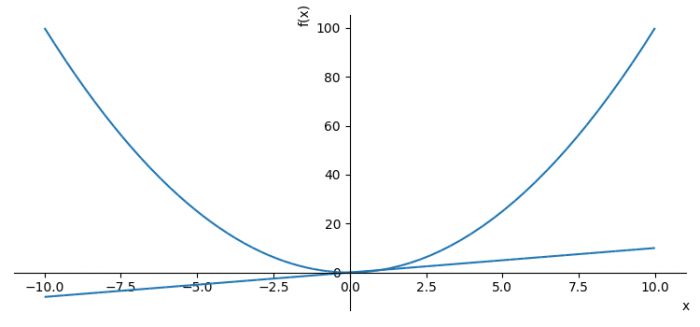
Display two Sympy plots as one Matplotlib plot (add the second plot to the first)
To display two sympy plots as one Matplotlib plot, we can take the following steps −
- Set the figure size and adjust the padding between and around the subplots.
- Transform strings into instances of :class:'Symbol' class.
- Plot a function of a single variable as a curve.
- Use the extend method to add all the series of plot2 (p2) in plot1 (p1).
- To display the figure, use show() method.
Example
from sympy import symbols
from sympy.plotting import plot
from matplotlib import pyplot as plt

plt.rcParams["figure.figsize"] = [7.50, 3.50]
plt.rcParams["figure.autolayout"] = True

x = symbols('x')

p1 = plot(x*x, show=False)
p2 = plot(x, show=False)
p1.extend(p2)

p1.show()
Output

Updated on: 2021-07-07T10:47:19+05:30
1K+ Views

Advertisements