
 Data Structure
 Networking
 RDBMS
RDBMS Operating System
 Java
Java MS Excel
 iOS
iOS HTML
HTML CSS
CSS Android
 Python
 C Programming
 C++
C++ C#
C# MongoDB
 MySQL
MySQL Javascript
 PHP
PHP
- Selected Reading
- UPSC IAS Exams Notes
- Developer's Best Practices
- Questions and Answers
- Effective Resume Writing
- HR Interview Questions
- Computer Glossary
- Who is Who
Digital High Pass Butterworth Filter in Python
The high pass filter is the electronic filter which passes the frequency of signals greater than the defined cutoff frequency and the frequency of the signals lower than the cutoff will be attenuated. The attenuation of each frequency is based on the filter design. The High pass Butterworth filter has some specialized features defined as follows.
The sampling rate of the given input signal is given as 3.5 kHz
The edge frequency of the pass band is 1050 Hz
The edge frequency of the stop band is 600 Hz
The ripple of the pass band is 1 dB
The minimum attenuation of the stop band is 50 dB
Implementing a High band pass Butterworth filter
In Numpy library, we have a function namely, butter() of the scipy.signal module which is used to create the high pass Butterworth filter by defining the btype parameter as high. There are some step by step approaches to be followed to implement the high pass Butterworth filter using python.
Step 1 First we have to define the cutoff frequency to pass the higher frequencies f, sampling frequency fs, order of the filter.
Step 2 In python we have the library scipy, which have a function namely, scipy.signal.butter() which is used to design the Butterworth filter with the defined order and normalized frequencies, passing the btype parameter as high to implement the high band pass Butterworth filter.
Step 3 In this step we will create the filter for the given input signal frequency by using the scipy.signal.filtfilt() function to perform zero phase filtering.
Step 4 Now we will plot the output frequencies of the High band pass Butterworth filter and filtered output frequencies.
Example
In the following example, let's implement a High band pass Butterworth filter by combining all the above mentioned steps.
import numpy as np
import matplotlib.pyplot as plt
from scipy.signal import butter, filtfilt
t = np.linspace(0, 1, 1000, False)
signal = np.sin(2*np.pi*10*t) + np.sin(2*np.pi*100*t)
cutoff_freq = 50
nyquist_freq = 0.5 * 1000
order = 4
b, a = butter(order, cutoff_freq/nyquist_freq, btype='high')
print("The output of the High band pass Butterworth filter:",b,a)
filtered_signal = filtfilt(b, a, signal)
print("The output of the filtered High band pass Butterworth filter:",filtered_signal[:60])
fig, (ax1, ax2) = plt.subplots(2, 1, sharex=True)
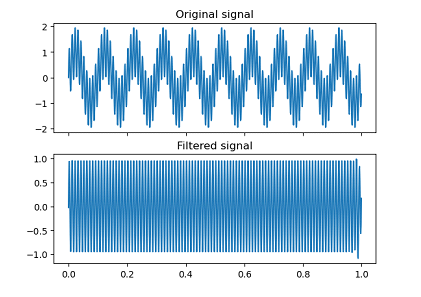
ax1.plot(t, signal)
ax1.set(title='Original signal')
ax2.plot(t, filtered_signal)
ax2.set(title='Filtered signal')
plt.show()
Output
The output of the High band pass Butterworth filter: [ 0.66201584 -2.64806335  3.97209502 -2.64806335  0.66201584] [ 1.         -3.18063855  3.86119435 -2.11215536  0.43826514]
The output of the filtered High band pass Butterworth filter: [-2.57011434e-02  5.64475188e-01  9.31854029e-01  9.37432917e-01
  5.80648022e-01 -6.03899720e-04 -5.82792538e-01 -9.42246958e-01
 -9.40658753e-01 -5.77939605e-01  7.75037248e-03  5.92806580e-01
  9.53638480e-01  9.52132388e-01  5.88467402e-01  1.10469679e-03
 -5.86050053e-01 -9.49131673e-01 -9.49796783e-01 -5.88050346e-01
 -2.23845805e-03  5.83791647e-01  9.46183479e-01  9.46562357e-01
  5.84873172e-01 -6.15470622e-04 -5.86140764e-01 -9.47928719e-01
 -9.47678403e-01 -5.85395096e-01  6.08034993e-04  5.86540005e-01
  9.48614035e-01  9.48529657e-01  5.86303028e-01  2.65455028e-04
 -5.85769804e-01 -9.47992382e-01 -9.48079252e-01 -5.86026799e-01
 -1.50482078e-04  5.85747803e-01  9.47864521e-01  9.47879310e-01
  5.85787696e-01 -9.84188511e-05 -5.85982516e-01 -9.48067401e-01
 -9.48039253e-01 -5.85899732e-01  3.39902671e-05  5.85961266e-01
  9.48082032e-01  9.48080846e-01  5.85958868e-01  3.37009709e-05
 -5.85892879e-01 -9.48019230e-01 -9.48028118e-01 -5.85918893e-01]

1K+ Views
