
Article Categories
- All Categories
-
 Data Structure
-
 Networking
-
 RDBMS
RDBMS
-
 Operating System
-
 Java
Java
-
 MS Excel
-
 iOS
iOS
-
 HTML
HTML
-
 CSS
CSS
-
 Android
-
 Python
-
 C Programming
-
 C++
C++
-
 C#
C#
-
 MongoDB
-
 MySQL
MySQL
-
 Javascript
-
 PHP
PHP
Selected Reading
Defining multiple plots to be animated with a for loop in Matplotlib
To define multiple plots to be animated with a for loop in matplotlib, we can take followings steps −
- Set the figure size and adjust the padding between and around the subplots.
- Create a new figure or activate an existing figure using figure method.
- Add an axes to the current figure and make it the current axes.
- Initialize two variables, N and x, using numpy.
- Get the list of lines and bar patches.
- Animate the lines and rectangles (bar patches) in a for loop.
- Make an animation by repeatedly calling a function *func*.
- To display the figure, use show() method.
Example
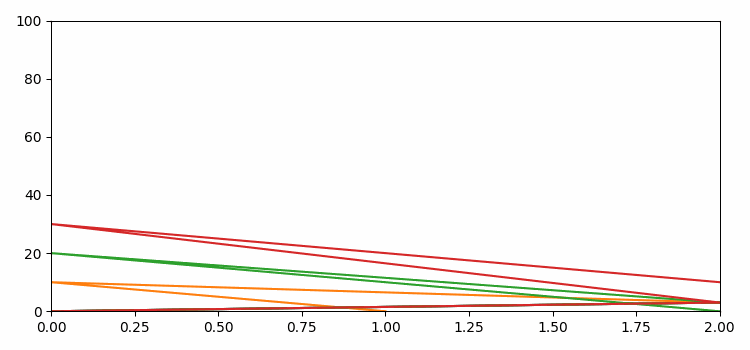
from matplotlib import pyplot as plt
from matplotlib import animation
import numpy as np

plt.rcParams["figure.figsize"] = [7.50, 3.50]
plt.rcParams["figure.autolayout"] = True

fig = plt.figure()
ax = plt.axes(xlim=(0, 2), ylim=(0, 100))
N = 4
x = np.linspace(-5, 5, 100)
lines = [plt.plot(x, np.sin(x))[0] for _ in range(N)]
rectangles = plt.bar([0.5, 1, 1.5], [50, 40, 90], width=0.1)
patches = lines + list(rectangles)

def animate(i):
   for j, line in enumerate(lines):
      line.set_data([0, 2, i, j], [0, 3, 10 * j, i])
   for j, rectangle in enumerate(rectangles):
      rectangle.set_height(i / (j + 1))
return patches

anim = animation.FuncAnimation(fig, animate,
                              frames=100, interval=20, blit=True)

plt.show()
Output

Updated on: 2021-06-16T12:19:49+05:30
3K+ Views

Advertisements