
Article Categories
- All Categories
-
 Data Structure
-
 Networking
-
 RDBMS
RDBMS
-
 Operating System
-
 Java
Java
-
 MS Excel
-
 iOS
iOS
-
 HTML
HTML
-
 CSS
CSS
-
 Android
-
 Python
-
 C Programming
-
 C++
C++
-
 C#
C#
-
 MongoDB
-
 MySQL
MySQL
-
 Javascript
-
 PHP
PHP
Selected Reading
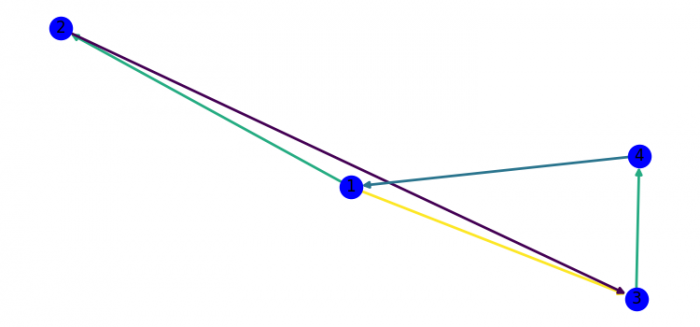
Colouring the edges by weight in networkx (Matplotlib)
To color the edges by weight in networkx, we can take the following steps −
- Set the figure size and adjust the padding between and around the subplots.
- Initialize a graph with edges, name, or graph attributes.
- Add nodes to the current graph.
- Add edges to the current graph's nodes.
- Iterate the given graph's edges and set some weight to them.
- Draw current graphs with weights for edge color.
- To display the figure, use show() method.
Example
import random as rd
import matplotlib.pylab as plt
import networkx as nx

plt.rcParams["figure.figsize"] = [7.50, 3.50]
plt.rcParams["figure.autolayout"] = True

G = nx.DiGraph()
G.add_nodes_from([1, 2, 3, 4])
G.add_edges_from([(1, 2), (2, 3), (3, 4), (4, 1), (1, 3)])
for u, v, d in G.edges(data=True):
   d['weight'] = rd.random()
edges, weights = zip(*nx.get_edge_attributes(G, 'weight').items())
nx.draw(G, node_color='b', edge_color=weights, width=2, with_labels=True)

plt.show()
Output

Updated on: 2021-06-09T12:03:59+05:30
3K+ Views

Advertisements